![]()
![]()
![]()
![]()
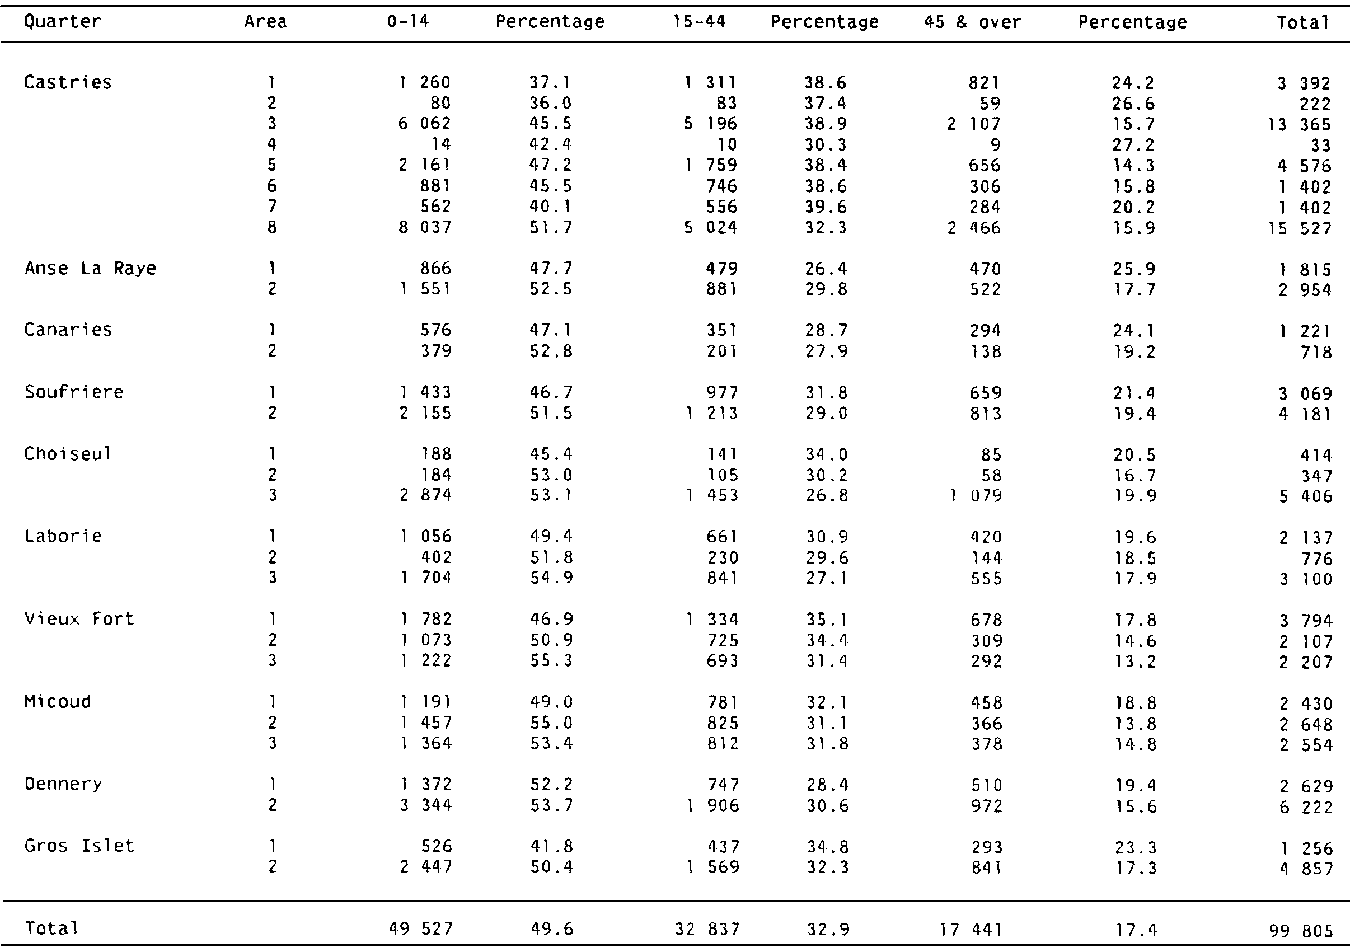
TABLE D-1. POPULATION AGE STRUCTURE, BY QUARTER AND AREA, 1970
Source: 1970 Population Census.
TABLE D-2. WORKING POPULATION IN AGRICULTURE, FORESTRY AND FISHING, BY QUARTER AND AREA ENGAGED, 1970
|
Quarter |
Area |
Total working population |
Agriculture, forestry, fishing |
|
|
N° |
% |
|||
|
Castries
|
1 |
1 280 |
22 |
1.7 |
|
2 |
84 |
6 |
7.1 |
|
|
3 |
4 105 |
226 |
5.5 |
|
|
4 |
10 |
2 |
20.0 |
|
|
5 |
1 285 |
59 |
4.6 |
|
|
6 |
584 |
38 |
6.5 |
|
|
7 |
493 |
11 |
2.2 |
|
|
8 |
3 946 |
1 930 |
48.9 |
|
|
Anse La Raye
|
1 |
530 |
261 |
49.2 |
|
2 |
781 |
253 |
32.4 |
|
|
Canaries
|
1 |
285 |
145 |
50.8 |
|
2 |
165 |
122 |
73.9 |
|
|
Soufriere
|
1 |
877 |
225 |
25.6 |
|
2 |
1 009 |
651 |
67.5 |
|
|
Choiseul
|
1 |
129 |
33 |
25.6 |
|
2 |
77 |
66 |
85.7 |
|
|
3 |
1 162 |
656 |
56.4 |
|
|
Laborie
|
1 |
573 |
162 |
28.2 |
|
2 |
137 |
109 |
73.5 |
|
|
3 |
541 |
409 |
75.6 |
|
|
Vieux Fort
|
1 |
1 078 |
356 |
23.0 |
|
2 |
476 |
166 |
34.8 |
|
|
3 |
525 |
424 |
80.7 |
|
|
Micoud
|
1 |
677 |
352 |
51.9 |
|
2 |
508 |
369 |
72.6 |
|
|
3 |
576 |
422 |
73.2 |
|
|
4 |
664 |
561 |
87.5 |
|
|
Dennery
|
1 |
667 |
303 |
45.4 |
|
2 |
1 569 |
1 270 |
80.9 |
|
|
Gros Islet
|
1 |
310 |
49 |
15.8 |
|
2 |
1 276 |
738 |
59.7 |
|
|
Total |
|
26 379 |
10 426 |
39.56 |
Source: 1970 Population Census.
![]()
![]()
![]()
![]()