

This report was prepared by Edsel B. Daniel, Box 1625, Station B, Nashville, TN 37235, U.S.A, [email protected]
Purpose
Beach Erosion Hazard in St. Kitts and Nevis
Preparation of Coastal Hazard Maps
Use of Beach Erosion Hazard Maps
Map Limitations
Further Research
Glossary
References
COSALC Coast and Beach Stability in the Caribbean
ESRI Environmental Systems Research Institute
IMF International Monetary Fund
GIS Geographic Information Systems
NHCS Nevis Historical and Conservation Society
OAS Organization of American States
PGDM Post-Georges Disaster Mitigation
UNESCO United Nations Educational, Scientific and Cultural Organization
UPR-SGCP University of Puerto Rico Sea Grant College Program
USAID United States Agency for International Development
This beach erosion hazard study for St. Kitts and Nevis was completed as part of the Organization of American States/U.S. Agency for International Development (OAS/USAID) Post-Georges Disaster Mitigation (PGDM) project. The goals of the beach erosion hazard study were to: a) map the relative erosion hazards along the coastline of St. Kitts and Nevis; and, b) identify areas for future research. Geographic information system (GIS) technology and mean annual beach change rate information were used to prepare these maps.
Coastal Erosion Phenomena: Most people are familiar and concerned with the beach since it is the portion of the coast where human activities are concentrated (Davis, 1996). This being the case, this report focuses on beaches and the term ‘coastal erosion’ refers to beach erosion.
Beach erosion occurs when sediment is removed from beaches at a rate that exceeds its replacement and is influenced by both natural processes and human factors. The most important natural process of concern to Caribbean islands is high energy waves during storms which cause dramatic erosion of their shorelines. For example, studies show that after the passage of Hurricane Luis in 1995, the average beach size shrank by 28 percent on seven Caribbean islands (Cambers, 1996), although it is important to note that some beach recovery did take place after the hurricane.
Another important natural factor is sea level rise. Surveys of beaches around the world show that sand loss from beaches and consequent landward movement of coastlines is very widespread (Clayton, 1995). Other factors are: a) loss of vegetation, such as seagrass, from the nearshore zone, grasses from coastal dunes, and mangroves, all of which provide sediment stability especially during severe erosion events; b) winter swells with high energy waves; and c) human factors (e.g. damming and diverting rivers, sand mining and construction of coastal structures).
Coastal Erosion Hazard: Like other Caribbean islands, coastal erosion hazards will continue to affect the economic and social sectors in St. Kitts and Nevis. Together the islands cover an area of 104 sq. miles and have a combined population of some 44,000. Their economy depends heavily on the tourism industry, which is still very much beach-oriented. According to the International Monetary Fund (IMF, 2000), ongoing investments in the hotel industry in 2000 should spearhead a pick-up in economic activity, with real Gross Domestic Product (GDP) growth projected at 3¾ percent. Of critical importance is the threat of beach erosion to the majority of existing and potential tourism facilities sited in areas located near the coastline (e.g. Pinneys Beach - Nevis; Frigate Bay, Basseterre, and the Southeast Peninsula - St. Kitts).
The impacts of coastal erosion have already been felt in recent years. As Barrett and Huggins (1997) noted, in September 1995, Hurricane Luis caused dramatic shoreline erosion at most west coast beaches in Nevis and also extensive damage to coastal infrastructure. Also in 1998, Hurricane Georges caused $ 445 million in damage, which included destruction of the main berthing platform on Port Zante in Basseterre, and damage to several major hotels (USAID, 1999). The big challenge is to implement hazard mitigation strategies that will minimize or eliminate the degree of risk to human life and property from coastal erosion hazards. This study makes a key step toward meeting this challenge by utilizing existing coastal erosion information to identify and map coastal erosion hazard areas in St. Kitts and Nevis.
The method used to assess the beach erosion hazards and the preparation of hazard maps is summarized below.
To create maps showing relative beach erosion hazards, it was necessary to create relative erosion hazard rankings for each coastal area. The assessment of beach erosion hazard is an estimation of a coastal area’s susceptibility to erosion based on a number of factors such as historical coastal changes, geomorphology, wave and current patterns and human activities. In this study, because of time limitations, only mean annual beach change rate information was used. This data was provided by the Department of the Environment in St. Kitts, and by the Nevis Historical and Conservation Society and the Physical Planning Department in Nevis. These agencies have measured beach changes at 35 beaches (21 in St. Kitts; 14 in Nevis) on a quarterly basis over a 9 year period in St. Kitts and an 11 year period in Nevis. These beach monitoring programs were established as part of a regional beach monitoring project ‘Coast and beach stability in the Caribbean’ (COSALC) which is sponsored by the United Nations Educational, Scientific and Cultural Organization (UNESCO) and the University of Puerto Rico Sea Grant College Program (UPR-SGCP).
Beach profiles are measured, from which various information can be extracted. In this study, profile width is used, this is the width of the beach, measured from the vegetation line into the sea. Variation in the beach width is used to calculate mean annual beach change rates. If the beach width decreases over time, this is interpreted as an erosion rate while if the beach width increases, this is an accretion rate.
The method adopted in this study takes the maximum and minimum mean annual beach change rates for each island and subdivides this range into equal intervals. The five relative erosion hazard categories defined were: Very High, High, Moderate/Medium, Low and Very Low. The very high category would identify those beaches with highest erosion rates. Results are presented in Table 1.
In this study, Environmental Systems Research Institute’s (ESRI) state-of-the-art ArcView (GIS) software was used to produce island-wide beach erosion hazard maps. OAS, with the assistance from the University of the West Indies, provided the coastline and other reference GIS layers (e.g. roads, contours, and rivers). These layers were generated from topographic maps of St. Kitts and Nevis at scale 1:25,000.
Beach erosion hazard maps have been prepared for both islands at scale 1:50,000. Sample hazard maps are shown in Figures 1 and 2. These maps convey information on beach erosion hazards in St. Kitts and Nevis in a format for technical (e.g. Planners, Engineers) and non-technical (e.g. landowners, general public) users.
|
Island |
Erosion Hazard Categories:Erosion(-)/Accretion(+) Ranges [m/yr] |
Beach |
Mean Annual Beach Change Rate: Erosion(-)/Accretion(+) [m/yr] |
Erosion Hazard Ranking |
|
St. Kitts |
Very High: -3.00 to -2.17 High: -2.17 to -1.34 Moderate: -1.34 to -0.50 Low: -0.50 to 0.33 Very Low: 0.33 to 1.16 |
Basseterre East |
0.92 |
Very Low |
|
Basseterre West |
-0.37 |
Low |
||
|
New Guinea Bay |
-0.17 |
Low |
||
|
Pump Bay |
-0.32 |
Low |
||
|
Belle Tete |
1.16 |
Very Low |
||
|
Dieppe Spit West and North |
-1.55 |
High |
||
|
Dieppe Spit East and Caines Pasture |
0.46 |
Very Low |
||
|
Sandy Bay |
-3.00 |
Very high |
||
|
Conaree |
-0.03 |
Low |
||
|
Halfmoon Bay |
-2.95 |
Very high |
||
|
North Frigate Bay |
0.73 |
Very Low |
||
|
North Friars Bay |
-1.88 |
High |
||
|
Sand Bank Bay |
-2.88 |
Very High |
||
|
Mosquito Bay |
-0.78 |
Moderate |
||
|
Cockleshell Bay |
-0.05 |
Low |
||
|
Banana Bay |
-0.53 |
Moderate |
||
|
Majors Bay |
-1.02 |
Moderate |
||
|
Ballast Bay |
0.09 |
Low |
||
|
Whitehouse Bay |
0.36 |
Very Low |
||
|
South Friars Bay |
-1.77 |
High |
||
|
South Frigate Bay |
-0.56 |
Moderate |
||
|
Nevis |
Very High: -2.41to -2.31 High: -2.31 to -1.38 Moderate: -1.38 to -0.8 Low: -0.8 to 0.05 Very Low: 0.05 to 2.03 |
Gallows Bay |
-1.72 |
High |
|
Pinneys Beach Hotel |
-2.31 |
Very High |
||
|
Pinneys Golden Rock |
-1.25 |
Moderate |
||
|
Pinneys Jessup |
-1.38 |
High |
||
|
Pinneys Mariners |
2.03 |
Very Low |
||
|
Pinneys Cotton Ground |
-2.41 |
Very High |
||
|
Cades Bay |
0.005 |
Low |
||
|
Mosquito Bay |
1.01 |
Very Low |
||
|
Hurricane Hill |
-1.24 |
Moderate |
||
|
Newcastle |
-0.80 |
Moderate |
||
|
Nisbett |
-0.86 |
Moderate |
||
|
Longhaul Bay |
1.04 |
Very Low |
||
|
White Bay |
-1.08 |
Moderate |
||
|
Indian Castle Bay |
-1.21 |
Moderate |
Table 1: Beach Erosion Hazard Rankings for St. Kitts and Nevis
 Figure
 1: Beach Erosion Hazard Map for St. Kitts
Figure
Figure 1: Beach Erosion Hazard Map for St. Kitts
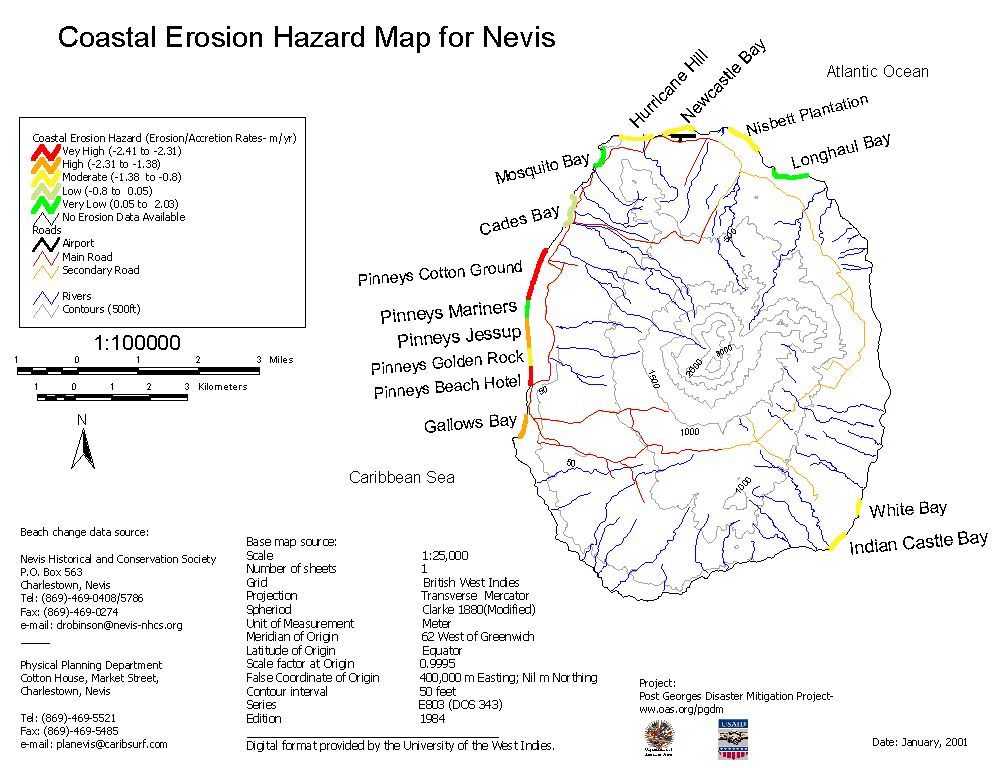
Figure 2: Beach Erosion Hazard Map for Nevis
The majority (5 of 6) beaches assigned very high and high hazard ratings in St. Kitts are located on the Atlantic coast. The second pattern revealed is that the majority (7 of 9) of beaches on the Caribbean coast have a low or very low hazard rating. These results are not surprising and support the theory that the higher the wave, the more energy exists for moving coastal sediment. As Cambers (1998) notes, in the Caribbean waves approach predominantly from the easterly direction and generate the highest waves, averaging over 1m (3 ft), on the windward or Atlantic coast. While on the leeward or Caribbean coast, average wave height is usually less then 0.3m (1ft).
On the Nevis coastline, the results are different. Here, the coastal areas with very high and high hazard rankings are located along the west or Caribbean coast, especially Pinneys Beach. But even then, not all of Pinneys Beach experiences high erosion hazard ranking. The section near the Mariners Inn has a very low ranking and the beach here is getting wider. It is interesting to note that in both islands, beaches near the northwest corner, Belle Tete in St. Kitts and Mosquito Bay in Nevis, show accretion and very low hazard ranking. These maps highlight the coastal areas that appear to present the high erosion hazards. They also emphasize the fact that each beach is unique in its behavior and it is therefore difficult and perhaps unwise to try and generalize.
These maps can be used as tool to:
This study suffered from limited data on one key GIS layer- settlements. The absence of this reference layer limits the user’s ability to spatially orient existing settlements relative to the coastline and identify those communities at potential risk from coastal erosion. The lack of data on factors influencing beach erosion also restricts the utility of the hazard method used. In addition, the roads layer was generated from a 1984 topographic map (Opadeyi, 2000). Consequently, the roads layer does not represent the current road network especially in the southeastern peninsula area.
The method used to produce the erosion hazard categories makes the assumption that these historical rates will continue in the future. However, the coastal erosion process is complex and other factors should be considered when defining relative erosion hazards. Therefore, the user must keep this in mind when using these maps.
It is also important to highlight existing limitations of the method used to calculate the beach change rate information. The drawback with using mean beach change rate information is that it may not tell the true story as average values tend to cover up severe erosion during episodic events. Therefore, there is no distinction between long term erosion trends and erosion resulting from short-term events.
In addition, erosion patterns over a period of time at fixed profile monitoring sites may be local and do not represent the entire beach. The problem here is that the two or three profiles located on beaches with lengths up to 1000 meters, may not always fully capture the entire beach changes over a period of time.
Notwithstanding the above limitations, the results provide a broad picture and general understanding of the erosion patterns and hazards on both islands.
It is recognized that the method used in this report is computationally simple and does not incorporate all the factors that influence coastal erosion. To take the work completed under this study forward, the following key areas are presented for further research. The writer has started research in some of these areas.
1. Mapping Coast and Marine Features: New satellite images, IKONOS, with higher resolution became available in December 1999. Research is needed to evaluate the use of these new images and global positioning systems as a source of GIS data, which can be utilized for coastal mapping, GIS application development. Additional information on coastal features can also be used in a more rigorous coastal erosion hazard.
2. Coastal Erosion Modeling: Beach erosion models provide the ability to better understand beach dynamics and predict beach erosion/accretion patterns under different coastal conditions. Research is needed to test/calibrate existing beach erosion models with beach profile data collected under the regional COSALC Project.
3. Coastal Management and Analysis System: It is recommended that geographic information system (GIS) be used to integrate data collected under the beach monitoring program with corresponding spatial information to generate thematic maps, and perform spatial, and other advanced analyses. A summary of the recommended analyses is presented below.
Erosion/Accretion Data Analysis: Routines for the analysis would allow users to: a) identify and locate sensitive beaches with a specified erosion rate; b) calculate erosion and accretion rates over a specified period for a particular beach or category of beaches; c) compare erosion and accretion rates between beaches or categories of beaches over a specified period; and d) calculate beach sand volume changes over a specified period for a particular beach.
Risk Analysis: Routines for the analysis would allow users to evaluate the potential risk coastal erosion poses to existing coastal development and infrastructure.
Setback Analysis: Routines for the analysis would allow users to calculate individual setback distances for new buildings from the active beach zone.
Scenarios: Routines for the analysis would allow users to study the potential impacts of coastal erosion or implementing coastal planning policies (e.g. setback distances).
Coastal Information Dissemination via the Internet: These tools would facilitate the effective sharing and disseminating of coastal information using state-of-the-art Internet GIS technology.
Accretion: accumulation of sand or other beach material due to the natural action of waves, currents, wind; a build-up of sand.
Beach: an accumulation of unconsolidated sediment that is transported and molded into characteristic forms by wave-generated water motion.
Beach erosion: the removal of sediment from beaches at a rate that exceeds its replacement. The removal of sediment can be a natural process or man induced.
Beach Profile: a side view of a beach extending from the top of the dune line into the sea.
Geographic Information Systems (GIS): a computer technology that combines geographic data (the location of man-made and natural features on the earth’s surface) and other types of information (names, classifications, addresses, and much more) to answer queries, perform analyses, and generate visual maps and reports.
Hazard: the occurrence of a phenomenon (e.g. coastal erosion) which has the potential for causing damage to or loss of buildings, natural ecosystems and infrastructure.
Hazard mitigation: the set of activities implemented to minimize or eliminate the risk to property and human life from a hazard.
Risk: the frequency of incidents and their associated consequences. Coastal erosion risk is the combination of the frequency of erosion along the coastline and the magnitude of associated impacts on coastal development, natural ecosystems and infrastructure.
Topographic map: a map type showing a limited set of features but including, at the minimum, information about elevations or landform. These maps are common for navigation and for use as reference maps.
Barrett, A. and Huggins, L. Hurricane Impacts in Nevis. In Coastal regions and small island papers, No. 1, UPR/SGCP-UNESCO, Mayaguez, Puerto Rico. 1997.
Cambers, G. Hurricane impacts on beaches in the eastern Caribbean islands. Coast and Beach Stability in the Caribbean (COSALC) report. 1996.
Cambers, G. Coping with Beach Erosion. UNESCO Publishing, Paris, France. 1998.
Clayton, K. Predicting sea-level rise and managing the consequences. In O’Riordan, T. (editor), Environmental Science for Environmental Management. John Wiley and Sons, New York. 1995.
Davis, R.A. Coasts. Prentice Hall, New Jersey 1996.
International Monetary Fund (IMF). Public Information Notice: IMF Concludes Article IV Consultation with St. Kitts and Nevis. www.imf.org/external/np/sec/pn/2000/pn00104.htm. December, 2000.
Opadeyi, J. Development of Digital Elevation Model for Antigua, Barbuda, St. Kitts, and Nevis. 2000 www.oas.org/pgdm/data/dem_rept.htm
USAID. Hurricane Georges Reconstruction and Recovery in the Eastern Caribbean. 1999. http://hurricane.info.usaid.gov/spoec.html.