

This report was prepared by Edsel B. Daniel, Box 1625, Station B, Nashville, TN 37235, U.S.A, [email protected]
Special thanks are extended to Dr. Gillian Cambers for work on preparing the beach erosion data and input on the coastal erosion hazard methodology.
Thanks are also extended to Mr. Philmore James and Dr. Mark Abkowitz for their input on the coastal erosion hazard methodology.
I would also like to thank the following persons for their contribution: Mr. Keith Nichols, Ms. Sharon Samuel, Mr. Ralph Wilkin and Ms. Robbie Wynn
Acknowledgements
Table of Contents
List of Tables and Figures
Acronyms
1.0 Introduction
2.0 Coastal Erosion3.0 Project Overview
4.0 Methodology
5.0 Coastal Erosion Hazard Results
6.0 Further Research
References
Appendix I: Beach Profile Methodology and Calculations
Appendix II: Annual Beach Width Data
Appendix III: Coastal Hazard Map Layout
Appendix IV: Terms of Reference
Appendix V: Base Map Data Source
Figure 2.1.1: Typical beach profile
Figure 2.1.2: Relative frequency of occurrence of sediment types on the inner continental shelves of the world
Figure 2.2.1: Type of breaking waves
Figure 2.2.2: Longshore and rip currents
Figure 2.2.3: Tracks of storms that passed through the Caribbean from 1965
to 1995.
Figure 2.2.4: Typical beach profile changes during a storm
Figure 3.2: Location map of St. Kitts and Nevis
Figure 5.1.1: Coastal Erosion Hazard Map for St. Kitts
Figure 5.1.2: Coastal Erosion Hazard Map for Nevis
Table 4.1.1: Mean Annual Coastal Change Rates for St. Kitts and Nevis
Table 4.1.2: St. Kitts GIS base layers
Table 4.1.3: Nevis GIS base layers
Table 4.2.1: Method I- Erosion Hazard Categories
Table 4.2.2: Sample Mean Annual Beach Change Rate
Table 4.2.3: Method II- Erosion Hazard Categories
Table 4.2.4: Comparison of Method I and II Erosion Hazard Rankings
Table 5.1: Coastal Erosion Hazard Rankings for St. Kitts and Nevis
Table 6: Beach Erosion Models
COSALC Coast and Beach Stability in the Caribbean
CPACC Caribbean Planning for Adaptation to Climate Change Project
ESRI Environmental Systems Research Institute
IMF International Monetary Fund
GIS Geographic Information Systems
NHCS Nevis Historical and Conservation Society
OAS Organization of American States
PGDM Post-Georges Disaster Mitigation
UNESCO United Nations Educational, Scientific and Cultural Organization
UPR-SGCP University of Puerto Rico Sea Grant College Program
USACE United States Army Corp of Engineers
USAID United States Agency for International Development
Coastal erosion has for decades been a major concern for countries with coastal development. This is especially true for Caribbean islands which have traditionally focused most of their towns, villages and tourism facilities near the coast. Over the past fifteen years, Caribbean islands have experienced extensive damage to economic and social infrastructure as a result of coastal erosion during major storms. Very often the islands do not have the resources to recover from these events and resort to external aid to assist with the recovery process. In 1998, this was the case when Hurricane Georges struck the islands of Antigua, Barbuda, Nevis and St. Kitts. To enhance the capacity for hazard mitigation in these islands, the United State Agency for International Development and the Organization of American States have implemented the Post-Georges Disaster Mitigation (PGDM) Project. The coastal erosion hazard mapping presented in this study was completed as part of PGDM project for St. Kitts and Nevis. With this information at hand, coastal planners and policy makers can get a better understanding of coastal erosion hazards and make better management decisions regarding coastal development.
This report documents the work completed in the study and is organized as follows:
Section 2 introduces the concept of coastal erosion and the main factors influencing it.
Section 3 provides an overview of the coastal erosion hazard study.
Section 4 describes the methodology adopted for developing the coastal erosion hazard maps.
Section 5 presents the coastal erosion hazard mapping results for St. Kitts and Nevis, and the potential uses and limitations.
Section 6 concludes the study with recommendations for further research.
Nearly 50 percent of the present world population lives on or within a two-hour drive to the coast (Davis, 1996). For purposes of this study, emphasis is placed on sandy coasts or sand beaches. Two factors guided this decision: a) Sand beaches are the most favored part of the coast for human activities (Davis, 1996). b) Most of the coastal erosion information used in this study is based on measurements on sand beaches. Therefore, for the remainder of this report the term ‘coastal erosion’ will refer to sand beach erosion.
Davis (1982; cited in Hayes, 1985) defines a beach as an accumulation of unconsolidated sediment that is transported and molded into characteristic forms by wave-generated water motion. The landward limit of the beach is the highest level reached by average storm waves, exclusive of catastrophic storm surges, and the seaward limit is the lowest level of the tide. Figure 2.1.1 shows a typical steep (A) and flat (B) beach profile and their sections.
Figure 2.1.1 Typical beach profile (from Hayes, 1985) . HT- High Tide, LT- Low Tide
Sediments on beaches are usually comprised of sand particles and/or a combination of clay, silt, gravel, cobble or boulders. The texture and composition of beach sediment roughly represents the near-shore shelf sediments of the world. See Figure 2.1.2.
Figure 2.1.2: Relative frequency of occurrence of sediment types
on the inner continental shelves of the world (from Hayes, 1985)
Beach erosion takes place when sediment is removed from beaches at a rate that exceeds its replacement. The removal of sediment can be a natural process or man induced. On the other hand, beach accretion is the reverse process where sediment is accumulated. A key component of the natural process of sediment transport on beaches is the dune. This feature is usually located in the backshore and has sand reserves, which serve two functions: a) protection of landward areas from erosion during storms and b) provide sediment that allows beaches to rejuvenate after periods of erosion.
There are several key factors that influence beach erosion. These are discussed below. These discussions are guided by Hayes (1985) and Komar (1983;1998).
Waves
Waves arriving at beaches are formed when the wind blows over the sea surface and its energy is transferred to the water. These waves are generally termed progressive waves because they move in the general direction the wind is blowing. Waves generally have two common forms: seas and swell. Seas are highly irregular waves with pointed crests. They generally have a wide range of wave heights, lengths and periods, which are influenced by wind velocity and the distance over which the wind blows and wind duration. Conversely, swells are formed when the wind stops blowing and seas become more rounded and smooth in appearance. These waves tend to travel in groups with equal velocities.
When waves break on the beach they transfer energy which may move the beach sand. There are typically three types of breaking waves occurring on beaches depending on the slope of the beach. Spilling breakers are common on gently sloping beaches. They expend their energy over a wide surf zone and thus tend to deposit sand onto the beach. Plunging breakers occur as beach slope increases. They tend to be more violent than spilling waves and expend their energy rapidly over a narrow width of the surf zone. As a result, they tend to entrain more sediment than spilling waves. Surging breakers occur on beaches with steep slopes and are characterized by a sloshing up and down the beach. These waves generally cause shoreline erosion and retreat. A schematic of all three types of breaking waves is shown in Figure 2.2.1.
Figure 2.2.1: Type of breaking waves (from Hayes, 1985)
Currents and Sediment Transport along Beaches
According to Hayes (1985), over 90 percent of near-shore sand transport takes place in the surf zone. In this area currents are the prime factors influencing this process. There are three categories of currents that influence beach changes. These are tidal, ocean and wave-generated currents. Tides are periodic rising and falling of large bodies of seawater resulting from the gravitational pull of the moon and sun on the rotation of earth. Tides generate currents that flow in one direction as the tide is rising and in the opposite direction as the tide is falling. These tidal currents contribute to movement of sand along the beach. Ocean currents also help to shape the coastal area but to a lesser extent. Wave generated currents (longshore and rip currents) are the primary cause of sand transport on beaches. Continuous action of oblique waves induces rip currents and longshore currents. Rip currents flow from the beach seaward and in the process remove beach sediment while longshore currents carry sediment parallel to the beach. This is illustrated in Figure 2.2.2.
Figure 2.2.2: Longshore and rip currents (from Hayes, 1985)
Coastal Morphology
The shape of a beach can often influence the rate of erosion. Generally, a steep beach would erode faster than one with a gentle slope. The presence of coastal structures such as piers and groynes tend to alter the natural erosion and accretion processes along a beach. In addition, the presence of offshore features such as fringing and barrier reefs tend to absorb wave energy available for sediment movement.
Sea Level Rise
It has been well documented (Pethick, 1991; Clayton, 1995; Davis, 1996; Komar, 1998) that sea levels will rise due to climate change. Even though there are still doubts that this is actually happening, the influence of sea level rise on beach erosion can be severe, especially in countries with coastal lands below sea level. Surveys of beaches around the world show that sand loss from beaches and consequent landward movement of coastlines is very widespread (Clayton, 1995).
Vegetation
Vegetation (e.g. grass) provides stability to sand reserves in coastal zones. On coastal dunes vegetation prevents excessive sediment loss during severe erosion events. Similarly, in bays and lagoons, the presence of seagrass beds and mangroves also provides stability for near-shore sediments during erosion events.
Storms
The most dramatic erosion of shorelines occurs during storms when surging waves are prevalent and their eroding effects are greatly increased. Waves can reach tremendous heights and velocities. Every year storms affect the coastlines of the Caribbean islands. Figure 2.2.3 shows the historical path of storms in the Caribbean region from 1965 to 1995.
Figure 2.2.4 shows how a typical beach profile changes during a storm. After the passage of Hurricane Luis in 1995, Cambers (1996) estimated that the average beach size shrank by 28 percent on seven Caribbean islands, although there was considerable recovery after the hurricane.
Seasonal Nature of Beach Erosion
During the summer months, the Caribbean Sea tends to be calmer with spilling type waves that usually assist with accretion. The exception will be during the passage of a storm. During the winter months the Caribbean Sea experiences winter swells with plunging and/or surging type waves, which cause beaches to erode. Generally, if the amount of winter erosion exceeds summer accretion, there is overall erosion with the land behind the beach being eroded as the beach retreats.
Man-Induced Changes in Sand Supply
If the natural supply of sand to a beach is removed, eventually it will erode. Man has constantly altered this natural supply of sand by building coastal structures and altering natural waterways. Typical examples are: a) Damming and diverting rivers, b) Sand mining and c) Construction of coastal structures.
Figure 2.2.3: Tracks of storms that passed through the Caribbean from 1965
to 1995. (from Online Hazards Maps, http://users.aol.com/mwhitney1/atlhur65.gif)
Figure 2.2.4. Typical beach profile changes during a storm (from USACE, 1984)
The coastal erosion hazard study was completed as part of the Post-Georges Disaster Mitigation Project (PGDM) project. This section provides an overview of the PGDM project (OAS, 2000) and highlights the main concern for coastal erosion hazards in St. Kitts and Nevis.
In most Caribbean islands, people have chosen to live and develop in coastal areas that have high risks of storms, repeated flooding and seismic activity, often with little or no attention to the need for sound building practices or land use planning. In 1998, Hurricane Georges caused extensive damage to high risk areas in Antigua, Barbuda, Nevis and St. Kitts. In response to this damage, the US Agency for International Development established a project entitled: Hurricane Georges Reconstruction and Recovery in the Eastern Caribbean. This project targets the aforementioned islands and consists of three components: a) Restoring hospital services (St. Kitts only); b) Enhancing local capacity for disaster mitigation; and c) Reactivating economic activities.
The Organization of American States as the implementing agency for the disaster mitigation capacity building component created a project entitled Post-Georges Disaster Mitigation (PGDM). PGDM is intended to reduce the vulnerability of population and economic activities in these islands to natural hazards, including tropical storms and related flooding and seismic and volcanic hazards, through enhanced capacity for hazard mitigation. Under this broad goal, four specific objectives will be pursued:
The PGDM is currently supporting assessments of the following hazards in Antigua and Barbuda, and St. Kitts and Nevis: Inland flooding, storm surge, wind, coastal erosion, inland erosion, drought and volcanic hazards. This study contributes to this effort by presenting the coastal erosion hazard mapping for St. Kitts and Nevis.
Over the past two decades, there has been devastation caused by coastal erosion during hurricanes such as Hugo, Luis, Marilyn and Georges. These natural events cannot be prevented, but studying the dynamics and effects on the coastal zone allows us to design and implement better strategies for mitigating their impacts. The need to perform these tasks is becoming an urgent issue as future predictions for storms and other natural disasters indicate an increase in frequency and intensity. There are a number of solutions that can be used to address beach erosion. Unfortunately, most of the common solutions such as beach replenishment and groynes are not only cost prohibitive but usually only provide temporary relief (Davis, 1996).
Like other Caribbean islands, natural hazards will continue to affect the economic and social sectors in St. Kitts and Nevis (location shown in Figure 3.2). Together the islands cover an area of 104 sq. miles and have a combined population of some 44,000. With an economy that has seen losses (reaching about 3½ percent of Gross Domestic Product (GDP) a year) in the sugar industry (International Monetary Fund (IMF), 2000), the Government has shifted focus to other sectors such as offshore financial services (especially in Nevis), light manufacturing and tourism which is leading the way. According to the IMF (2000) ongoing investments in the hotel industry in 2000 should spearhead a pick-up in economic activity, with real GDP growth projected at 3¾ percent. Of critical importance is the threat of beach erosion to the majority of existing and expected tourism facilities sited in areas located near the coastline (e.g. Pinneys Beach- Nevis; Frigate Bay, Basseterre, and the Southeast Peninsula - St. Kitts).
In recent years, the impacts of coastal erosion have been evident for all to see. For example, in 1995 Hurricane Luis caused dramatic shoreline erosion at most west coast beaches (e.g. Pinneys Beach) in Nevis which resulted in extensive damage to coastal infrastructure (Barrett and Huggins, 1997). Also in 1998, Hurricane Georges caused $ 445 million in damage, which included destruction of the main berthing platform on Port Zante in Basseterre, and damage to several major hotels. An estimated 500 of the 1,445 hotel rooms were damaged. Most tourist facilities were closed for at least two months and several beaches were badly eroded. Because St. Kitts relies on its tourist industry for much of its national income, the economic effects of the hurricane were more significant than initial damage assessments (USAID, 1998; 1999). The big challenge is to implement hazard mitigation strategies that will minimize or eliminate the degree of risk to human life and property from coastal erosion hazards. This study takes initial steps towards addressing the challenge by mapping the relative erosion hazards along the coastline of St. Kitts and Nevis and highlights areas for further research.
Figure 3.2: Location of St. Kitts and Nevis
In this coastal erosion hazard study, it must be noted that limited information is available on coastal erosion. This section outlines the methodological approach to data collection and analysis required for completing the coastal erosion hazard mapping.
Mean Annual Beach Width
To create thematic maps showing relative coastal erosion hazards, it was necessary to develop relative erosion hazard rankings/categories for each coastal area. The assessment of the coastal erosion hazard is an estimation of a coastal area’s susceptibility to erosion and should be based on a number of factors such as historical coastal changes, geomorphology, wave and current patterns and human activities. Due to time and other limitations, this study was only able to utilize mean annual beach change rate information to determine the relative erosion hazard categories. The method used to create these hazard rankings is presented in section 4.2.
In 1991, the Fisheries Division and the Southeast Peninsula Board established a beach monitoring program in St. Kitts within the regional Coast and Beach Stability in the Caribbean (COSALC) project, sponsored by the United Nations Educational, Scientific and Cultural Organization (UNESCO) and the University of Puerto Rico Sea Grant College Program. In 1997, the newly established Department of the Environment took over responsibility for beach monitoring. In 1988 the Nevis Historical and Conservation Society (NHCS) and the Fisheries Division started beach monitoring in Nevis within the framework of the same regional initiative, in 1999 the Physical Planning Department became partners in the monitoring program.
The selection of beaches for monitoring was based on the following characteristics:
Beaches are surveyed on a quarterly basis, although during the first two years of monitoring in St. Kitts (1992-1993) beaches in the Southeast Peninsula were measured monthly. In addition beaches are measured at more frequent intervals after major hurricane events to monitor recovery. Two beach parameters (profile cross-sectional area and profile width) are recorded. The methodology and mathematical calculations for deriving these parameters are shown in Appendix I. A total of 35 beaches are monitored: 21 in St. Kitts; 14 in Nevis. Mean annual profile width data for these beaches are shown in Appendix II.
Dr. Gillian Cambers, COSALC project coordinator, provided annual beach change rates for each beach monitored as shown in Table 4.1.1. To determine these rates, the average profile width at a particular site for the first year of measurement was compared with the same parameter for the last year of measurement, and the difference between the two figures was divided by the number of years of measurement to provide a rate of coastal change in meters per year. A negative beach change rate is interpreted as an erosion rate while a positive beach change rate as an accretion rate.
Rates of change on rocky beaches have been measured at three sites in St. Kitts: New Guinea Bay, Ballast Bay and Whitehouse Bay. Table 4.1.1 shows that annual beach change rates at these three rocky beaches are very low, -0.17, 0.09 and 0.36 meters/year respectively. Indeed when reviewing the beach monitoring results in 1997, it was decided to cease monitoring at Ballast Bay because of the very low rate of change there, and instead to concentrate efforts at other beaches. So in general, it appears that in St. Kitts, rates of beach change at rocky beaches are considerably lower than at sandy beaches. No rocky beaches are measured in Nevis.
Rates of change on cliffed shorelines have not been measured in St. Kitts or Nevis, but it is likely that they are considerably lower than those pertaining to sandy beaches. Although in the case of cliffs, erosion is not usually a gradual process, but a sudden one, as large blocks collapse especially in fractured rocks. See Cambers (2000a) for a more complete discussion.
The beach databases are stored and maintained at:
Department of the Environment,
Pelican Mall, P.O.Box 132,
Basseterre, St. Kitts.
Tel : (869)-465-4040
Fax: (869)-466-3915
Nevis Historical and Conservation Society,
P.O.Box 563,
Charlestown, Nevis.
Tel: (869)-469-0408/5786
Fax: (869)-469-0274
e-mail: [email protected]
Physical Planning Department.
Cotton House, Market Street,
Charlestown, Nevis.
Tel: 869 469 5521
Fax: 869 469 5485
e-mail: [email protected]
A back-up copy of the data is maintained at the UPR-SGCP:
University of Puerto Rico Sea Grant College Program,
P.O.Box 9011,
Mayaguez, Puerto Rico 00681
Tel 787 832 3585
Fax: 787 265 2880
e-mail: [email protected]
|
Island |
Beach |
Mean Annual Beach Change Rate: Erosion(-)/Accretion(+) [meters/year] |
|
St. Kitts |
Basseterre East |
0.92 |
|
Basseterre West |
-0.37 |
|
|
New Guinea Bay |
-0.17 |
|
|
Pump Bay |
-0.32 |
|
|
Belle Tete |
1.16 |
|
|
Dieppe Spit West and North |
-1.55 |
|
|
Dieppe Spit East and Caines Pasture |
0.46 |
|
|
Sandy Bay |
-3.00 |
|
|
Conaree |
-0.03 |
|
|
Halfmoon Bay |
-2.95 |
|
|
North Frigate Bay |
0.73 |
|
|
North Friars Bay |
-1.88 |
|
|
Sand Bank Bay |
-2.88 |
|
|
Mosquito Bay |
-0.78 |
|
|
Cockleshell Bay |
-0.05 |
|
|
Banana Bay |
-0.53 |
|
|
Majors Bay |
-1.02 |
|
|
Ballast Bay |
0.09 |
|
|
Whitehouse Bay |
0.36 |
|
|
South Friars Bay |
-1.77 |
|
|
South Frigate Bay |
-0.56 |
|
|
Nevis |
Gallows Bay |
-1.72 |
|
Pinneys Beach Hotel |
-2.31 |
|
|
Pinneys Golden Rock |
-1.25 |
|
|
Pinneys Jessup |
-1.38 |
|
|
Pinneys Mariners |
2.03 |
|
|
Pinneys Cotton Ground |
-2.41 |
|
|
Cades Bay |
0.005 |
|
|
Mosquito Bay |
1.01 |
|
|
Hurricane Hill |
-1.24 |
|
|
Newcastle |
-0.80 |
|
|
Nisbett |
-0.86 |
|
|
Longhaul Bay |
1.04 |
|
|
White Bay |
-1.08 |
|
|
Indian Castle Bay |
-1.21 |
Table 4.1.1: Mean Annual Beach Change Rates for St. Kitts and Nevis (Source: Cambers, 2000b)
GIS Layers
Based on the mapping requirements and terms of reference (See Appendix III and IV), the decision was made to use state-of-the-art ArcView geographic information system (GIS) software to produce island-wide coastal erosion hazard maps. GIS is a computer technology that combines geographic data (the location of man-made and natural features on the earth’s surface) and other types of information (names, classifications, addresses, and much more) for answering queries, performing analyses, and generating visual maps and reports.
OAS, with the assistance of University of the West Indies, provided the coastline and other reference GIS layers. These layers were generated from topographic maps of St. Kitts and Nevis at scale 1:25,000. See Appendix V for additional information on these maps. The GIS layers and associated information are listed in Tables 4.1.2 and 4.1.3.
The initial coastline layer was created as a polygon layer without information on beach location. Therefore, two additional processing steps were performed to: 1) Convert polygon to line layer. An ArcView (Avenue scripting language) Script provided by ESRI (2000), was used to perform this task. 2) Split the coastline layer into line segments, which show beach locations. Using the digital topographical map as the backdrop, heads up digitizing/editing tools in ArcView were used to perform this task.
|
Format |
FileName |
Content/Layers |
Attribute data |
|
Shapefiles |
skcoast.shp |
Coastlines |
|
|
" |
skconto3.shp |
Contours |
Elevation (50 ft) |
|
" |
sktrans.shp |
Roads and railways |
|
|
" |
skdrain.shp |
Drainage |
|
|
Image |
orthkitt.tif |
Georeferenced Map |
Table 4.1.2: St. Kitts GIS base layers (Source: OAS, 2000)
|
Format |
FileName |
Content/Layers |
Attribute data |
|
Shapefiles |
nvcoast.shp |
Coastlines |
|
|
" |
nvctour.shp |
Contours |
Elevation(50 ft) |
|
" |
nvroads.shp |
Roads |
|
|
" |
nvriver.shp |
Drainage |
|
|
Image |
Onevismp.tif |
Georeferenced Maps |
Table 4.1.3: Nevis GIS base layers (Source: OAS, 2000)
As pointed out earlier, the only information available for this study is mean annual beach change rate information. The assumption made is that these historical beach change rates are an indication of future beach change patterns.
For the purposes of this study, hazard is defined as the occurrence of a phenomenon (e.g. coastal erosion) which has the potential for causing damage to or loss of buildings, natural ecosystems and infrastructure. Based on the guidelines defined in the terms of reference (See Appendix IV), the mean annual beach change rates were used to establish five coastal erosion hazard categories: Very High, High, Moderate/Medium, Low and Very Low. Two methods were considered for creating the aforementioned categories. Both methods are outlined below.
Method I
This method that was guided by Cambers (2000c), is based on beach change rates in 13 territories, most (estimate 80%) beach change rates fall between –1 and +1 m/yr. Higher rates do occur, a further 15-19% (estimate) fall within the range –2 to +2 m/yr. Higher rates than this are due to unusual circumstances, e.g. several of the beaches in Barbuda show higher rates than this, which is at least partly due to the infrequency of measurement. Class hazard intervals for the five categories were established as shown in Table 4.2.1.
|
Beach Change Rates (meters/year) |
Hazard Categories |
|
-2.01 + |
Very high |
|
-1.01 to -2 |
High |
|
-0.01 to -1.0 |
Medium |
|
1.0 to 0 |
Low |
|
1.01+ |
Very low |
Table 4.2.1: Method I- Erosion Hazard Categories
Thus all beaches showing erosion over the period of measurement fall into the medium to very high hazard categories, and all beaches showing accretion over the period of measurement fall into the low to very low hazard categories.
Method II
The second method, which is guided by Abkowitz (2000), is similar to the first except it takes the range of beach change rates for each island and subdivides it into ranges of equal intervals. This method emphasizes how the beach change rate values fall within uniform beach change rate ranges, which define the relative erosion hazard categories. The interval width of each erosion hazard category is calculated using the equation below.
|
Interval width = |
(highest beach change rate value – lowest beach change rate value) |
|
number of hazard categories |
A sample calculation is shown below.
Sample Erosion Hazard Calculation
Assume beach change rate values for 10 beaches are as shown in Table 4.2.2.
|
Beach |
Mean Annual Beach Change Rate: Erosion(-)/Accretion(+) [meters/year] |
|
Kasa Bay |
-1.4 |
|
Nova Beach |
2.1 |
|
Small Beach |
0.22 |
|
Axe Beach |
1.9 |
|
Nu Beach |
-0.99 |
|
Vybes Bay |
1.1 |
|
Grand Bay |
1.6 |
|
Masters Beach |
-0.56 |
|
Bob Bay |
0.78 |
|
Marley Beach |
-1.98 |
Table 4.2.2: Sample Mean Annual Beach Change Rate
The width for each of the five hazard categories = (Highest Value – Lowest Value) /5 = (3.1 - (-1.98))/5 = 1.01
The relative erosion hazard categories are shown in Table 4.2.3. A comparison of the resulting hazard assignments for both methods is also shown in Table 4.2.4.
|
Relative Hazard Categories |
Beach Change Rate Range |
|
Very Low |
2.07 - 3.1 |
|
Low |
1.05- 2.06 |
|
Medium |
0.03 -1.04 |
|
High |
-0.96 - 0.04 |
|
Very High |
-1.98 - -0.97 |
Table 4.2.3: Method II- Erosion Hazard Categories
|
Beach |
Beach Change Rate: Erosion (- )/Accretion(+) (m/yr) |
Method I: Ranking |
Method II: Ranking |
|
Kasa Bay |
-1.4 |
High |
Very High |
|
Nova Beach |
2.1 |
Very Low |
Very Low |
|
Small Beach |
0.22 |
Low |
Low |
|
Axe Beach |
1.9 |
Very Low |
Very Low |
|
Nu Beach |
-0.99 |
Medium |
Very High |
|
Vybes Bay |
1.1 |
Very Low |
Low |
|
Grand Bay |
1.6 |
Very Low |
Low |
|
Masters Beach |
-0.56 |
Medium |
High |
|
Bob Bay |
0.78 |
Low |
Medium |
|
Marley Beach |
-1.98 |
High |
High |
Table 4.2.4: Comparison of Method I and II Erosion Hazard Rankings
Note that the hazard assignments are almost identical. However, method II is more conservative in assigning hazard rankings (e.g Kasa Bay, Nu Beach, Masters Beach and Bob Bay). After discussing both methods with coastal management consultants (Cambers, 2000c; James, 2000), method II was selected for this study.
This section presents the coastal erosion hazard results derived from the methods outlined in section 4. The use and limitations of these maps are also presented.
The resulting coastal erosion hazard rankings for St. Kitts and Nevis are shown in Table 5.1. The coastal hazard thematic maps generated from these rankings are shown in Figures 5.1 and 5.2. These maps are also provided at scale- 1:50,000.
Five levels of relative erosion were established for the coastal erosion hazard: (a) Very High; (b) High; (c) Moderate or Medium; (d) Low and (e) Very Low. Hazard is not an absolute and an accurate value is not possible with the data available. However, the results presented in this study do have some utility. The coastal erosion hazard maps can be used as a tool to:
|
Island |
Erosion Hazard Categories: Erosion(-)/Accretion(+) Ranges [m/yr] |
Beach |
Mean Annual Beach Change Rate: Erosion(-)/Accretion(+) [m/yr] |
Erosion Hazard Ranking |
|
St. Kitts |
Very High: -3.00 to -2.17 High: -2.17 to -1.34 Moderate: -1.34 to -0.50 Low: -0.50 to 0.33 Very Low: 0.33 to 1.16 |
Basseterre East |
0.92 |
Very Low |
|
Basseterre West |
-0.37 |
Low |
||
|
New Guinea Bay |
-0.17 |
Low |
||
|
Pump Bay |
-0.32 |
Low |
||
|
Belle Tete |
1.16 |
Very Low |
||
|
Dieppe Spit West and North |
-1.55 |
High |
||
|
Dieppe Spit East and Caines Pasture |
0.46 |
Very Low |
||
|
Sandy Bay |
-3.00 |
Very high |
||
|
Conaree |
-0.03 |
Low |
||
|
Halfmoon Bay |
-2.95 |
Very high |
||
|
North Frigate Bay |
0.73 |
Very Low |
||
|
North Friars Bay |
-1.88 |
High |
||
|
Sand Bank Bay |
-2.88 |
Very High |
||
|
Mosquito Bay |
-0.78 |
Moderate |
||
|
Cockleshell Bay |
-0.05 |
Low |
||
|
Banana Bay |
-0.53 |
Moderate |
||
|
Majors Bay |
-1.02 |
Moderate |
||
|
Ballast Bay |
0.09 |
Low |
||
|
Whitehouse Bay |
0.36 |
Very Low |
||
|
South Friars Bay |
-1.77 |
High |
||
|
South Frigate Bay |
-0.56 |
Moderate |
||
|
Nevis |
Very High: -2.41to -2.31 High: -2.31 to -1.38 Moderate: -1.38 to -0.8 Low: -0.8 to 0.05 Very Low: 0.05 to 2.03 |
Gallows Bay |
-1.72 |
High |
|
Pinneys Beach Hotel |
-2.31 |
Very High |
||
|
Pinneys Golden Rock |
-1.25 |
Moderate |
||
|
Pinneys Jessup |
-1.38 |
High |
||
|
Pinneys Mariners |
2.03 |
Very Low |
||
|
Pinneys Cotton Ground |
-2.41 |
Very High |
||
|
Cades Bay |
0.005 |
Low |
||
|
Mosquito Bay |
1.01 |
Very Low |
||
|
Hurricane Hill |
-1.24 |
Moderate |
||
|
Newcastle |
-0.80 |
Moderate |
||
|
Nisbett |
-0.86 |
Moderate |
||
|
Longhaul Bay |
1.04 |
Very Low |
||
|
White Bay |
-1.08 |
Moderate |
||
|
Indian Castle Bay |
-1.21 |
Moderate |
Table 5.1: Coastal Erosion Hazard Rankings for St. Kitts and Nevis

Figure 5.1.1: Coastal Erosion Hazard Map for St. Kitts
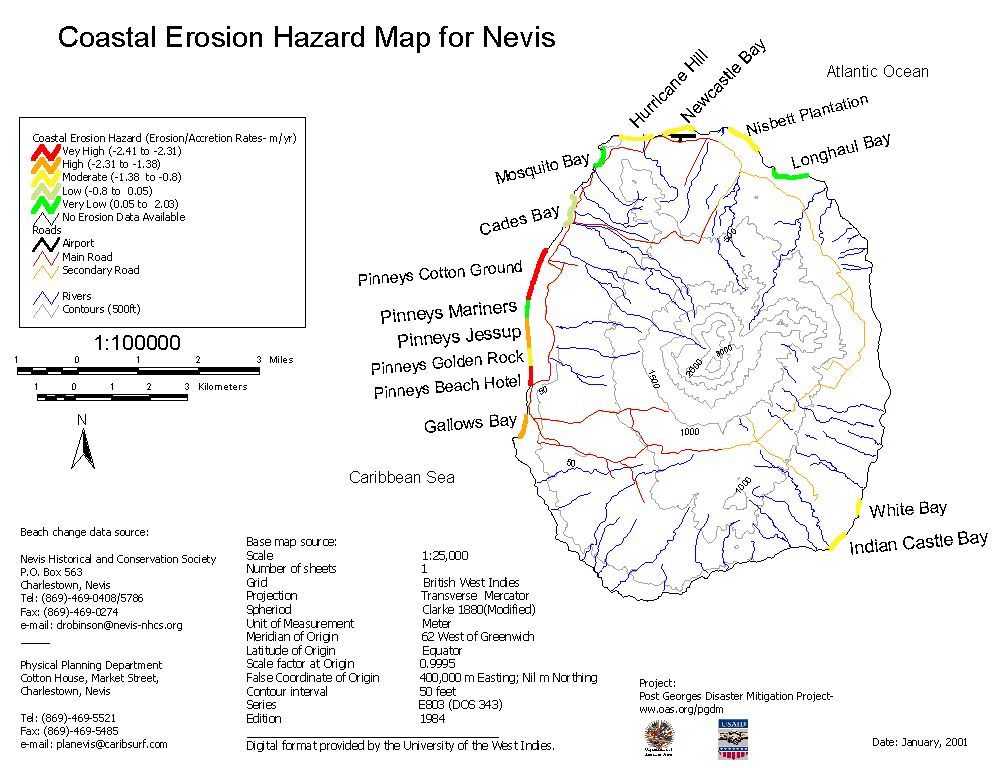
Figure 5.1.2: Coastal Erosion Hazard Map for Nevis
The results provide a broad picture and general understanding of the erosion patterns and hazards on both islands. For example, the majority (5 of 6) beaches assigned very high and high hazard ratings in St. Kitts are located on the Atlantic coast. The second pattern revealed is that the majority (7 of 9) of beaches on the Caribbean coast have a low or very low hazard rating. These results are not surprising and support the theory that the higher the waves, the more energy exist for moving coastal sediment. As Cambers (1998a) notes, in the Caribbean waves approach predominantly from the easterly direction and generates the highest waves, averaging over 1m (3 ft), on the windward or Atlantic coast. While on the leeward or Caribbean coast, average wave height is usually less then 0.3m (1ft). On the Nevis coastline, the results seem to reveal quite the opposite, although in Nevis, very few east coast beaches are monitored. The coastal areas with very high and high hazard rankings are located along the west or Caribbean coast, especially Pinneys Beach. Even though these results may be inconsistent with coastal erosion theory, it is consistent with highlighting the coastal areas that appear to present the high erosion hazards.
Despite the utility of the coastal mapping results, there are limitations to this study about which readers should be aware. These limitations are: a) Limited data, and b) Methodological deficiencies.
A key limitation this study faced was a lack of data for factors influencing coastal erosion and an unavailable GIS layer for settlements. The lack of data on factors influencing coastal erosion restricts the utility of the hazard method used. This is discussed further in the next section.
GIS data
It is important to note that coastal planners and decision-makers would not only be interested in erosion patterns and hazards but also the associated risks. Risk in this context is the combination of the frequency of erosion along the coastline and its associated impacts on coastal development, and infrastructure (Abkowitz, 2000). The hazard maps provide a basis for performing risk analysis. The potential impacts on infrastructure can be estimated using roads. However, the reference layer for settlements/developed areas is not shown. The absence of this reference layer would definitely limit the user’s ability to spatially orient existing settlements relative to the coastline and identify those communities at potential risk from coastal erosion. In addition, the roads layer was generated from a 1984 topographic map (Opadeyi, 2000). Consequently, the roads layer does not represent the current road network especially in the southeastern peninsula area.
The method used to produce the erosion hazard categories has the advantage of being conceptually and computationally simple. This method used the mean annual beach change rates over a 9-year period for St. Kitts, and over an 11-year period for Nevis, and makes the assumption that these historical rates will continue. However, it is important that the user is aware that the coastal erosion process is very complex and there are many factors that influence it. In this regard, the following methodological deficiencies are highlighted.
Factors influencing coastal erosion
A more rigorous hazard assessment could have been done if information on other factors (e.g. historical wave patterns, presence and extent of coastal features such as coral reefs, river systems and dunes) were available. Each factor could be assigned a relative weight according to its importance in influencing beach erosion. With these additional computations, the study results would be better suited for more advanced analyses such as a risk analysis. Therefore, the user must be aware of this limitation.
Beach Change Rates
The drawback with using mean beach change rate information is that it may not tell the true story as average values tend to cover up severe erosion during episodic events such as Hurricanes Georges and Luis. Take for example, Belle Tete beach on St. Kitts, which is ranked very low. This beach was observed to have been severely eroded after Hurricane Georges and recovered within a short time period (Nichols, 2000). Using a 10 or even a five-year beach change average rate may mask such extreme events. In this case, the overall effect of erosion and accretion would seem to be canceled out in an average beach change rate when in fact this beach is susceptible to erosion. This point highlights the distinction between long term erosion trends and erosion resulting from short-term events. It would be interesting to separate and rank the annual beach change rates due to long and short term effects, and combine these rankings to determine an overall erosion hazard. This could be included in a future study.
Beach Profile Surveys
It is understood that these islands have limited resources and cannot employ state-of-the-art survey techniques to collect accurate beach survey data. However, it is important to highlight existing limitations of the method used to generate the beach change rate information. As outlined in Appendix I, beaches have two or three reference points from where profile measurements are made. With some beaches ranging from 750 to 1000 meters in length, it is likely that erosion patterns may vary substantially along the beach face. At one end the beach can be accreting while eroding at the other. Consequently, erosion patterns over a period of time at a particular profile site may be local and not represent the entire beach. The problem here is that two or three profiles may not always fully capture the beach changes over a period of time. Therefore, this does introduce a degree of error in the beach change rate calculations.
This report presented the coastal erosion hazard study for St. Kitts and Nevis, and was conducted as part of the PGDM project. The study included ranking and mapping of erosion hazards along the coast of both islands. Using the equal interval method, five hazard categories (Very High, High, Medium/Moderate, Low, Very Low) were established from mean annual beach change rate information. It is recognized that the method is simple and does not incorporate other factors that influence coastal erosion. Despite these limitations, the map results do provide useful information that can be utilized by various users- public, planners, decision-makers and engineers.
Following the completion of this project, some useful suggestions were received from Dr. Cassandra Rogers of the University of the West Indies, relating to ways to enhance the coastal hazard mapping in St. Kitts and Nevis, and in Antigua and Barbuda, as well as in other such studies in different islands in the future. It was pointed out that the maps show the beach erosion hazard only, not the coastal erosion hazard, which would include other factors such as cliff erosion and changes in low rocky shores. In St. Kitts, in particular, there is concern locally about sections of the cliffed shoreline where erosion is taking place. However, quantitative data are not available for these sections of coastline. While additional information relating to the nature of the un-monitored coast, e.g. whether it consist of cliffs, beaches or other coastal forms, would be useful to the map user, this should be produced as an additional map, since it would complicate the beach erosion hazard maps. It was recommended that in future studies in other islands, alternatives to the equal interval method for determining the hazard categories should be considered. The beach change data sets are very small (21 beaches measured over 9 years in St. Kitts and 14 beaches measured over 11 years in Nevis), and not sufficiently robust for this method, since adding one new beach with an extreme erosion/accretion rate would change the hazard rating dramatically. Furthermore, the beach erosion hazard categories of high, medium, low etc. determined by the equal interval method, have different ranges in each island thereby reducing the opportunity for inter-island comparison.
Effective decision-making on the coast requires decision-makers and planners to have an understanding of the morphological, biological and human-oriented processes likely to be encountered within the coastal zone. This level of understanding is possible only when accurate, appropriate and timely information is available and presented in a format that is easily interpreted. According to Barlett (2000), an organized, planned and coherent coastal database should be seen as a sine qua non of good coastal management. Indeed the coastal erosion hazard analysis presented in this study does lack rigor but it does provide a starting point on which to build. To take the work completed under this study forward, additional research is needed. In this regard, the following areas are presented for further research. The writer has started research in some of these areas.
Mapping Coast and Marine Features: Mapping functionality and GIS data collection often is limited in most small Caribbean islands, as was the case in this study. Also in cases where traditional satellite sources (LANDSAT and SPOT) images are available but the resolution is not always adequate for the coastal planning purposes on these islands. New satellite images (IKONOS) with higher resolution became available in December 1999 and will shortly be made available to Antigua and Barbuda, and St. Kitts and Nevis through the Caribbean Planning for Adaptation to Climate Change (CPACC) project. Research is needed to determine the feasibility of using these new images and global positioning systems as a source of GIS data that can be utilized for: a) Mapping coastal and marine resources, conducting a more rigorous erosion hazard assessment and developing GIS based coastal applications; and b) Augmenting beach survey data collected under the COSALC project.
Coastal Erosion Modeling: Beach erosion models provide the ability to better understand beach dynamics and predict beach erosion/accretion patterns under different coastal conditions. Limited research has been done on the testing/developing coastal erosion models in the Caribbean. This research would provide an opportunity to test/calibrate existing beach erosion models with beach profile data collected under the COSALC project. Some institutions and their respective models are listed in the Table 6.
|
Institution |
Erosion Model |
Description |
|
Coastal and Hydraulics Laboratory, United States Army Corp of Engineers, Vicksburg, Mississippi (http://chl.wes.army.mil/) |
SBEACH (Storm-induced BEAch Change Model) |
SBEACH simulates cross-shore beach berm, and dune erosion produced by storm waves and water levels. The latest version allows simulation of dune erosion in the presence of a hard bottom. |
|
GENESIS (GENEralized Model for SImulating Shoreline Change) |
GENESIS simulates the long-term platform evolution of the beach in response to imposed wave conditions, coastal structures, and other engineering activity (e.g., beach nourishment). |
|
|
Delft Hydraulics Institute, Delft, Netherlands www.wldelft.nl/ |
Delft3D |
Delft3D is a framework of software modules for 2 and 3-dimensional flow, water quality, ecology, short wave propagation and morphology and their interactions. The software has been developed over the past 15 years and is still being extended and improved in functionality and application areas. |
|
DELFT-CHESS |
DELFT-CHESS is a suite of mathematical models for coastal, harbor and offshore engineering. These models are based on Delft lab latest research on such topics as water level prediction, simulation of wave and current conditions, sediment transport and morpho-dynamics in the near-shore zone - long-shore and cross-shore sediment transport, coastline dynamics and dune erosion. |
|
|
Ocean Engineering Program, US Naval Academy, Annapolis. (Kriebel, 1994) |
EDUNE |
EDUNE is a model that predicts the time-dependent evolution of existing or design beach and dune profiles for specified storm surge and storm wave conditions. The model is based on the application of equilibrium beach profile theory. |
|
Oregon State University, Covallis, Oregon. (Komar, 1998; Komar et.al. 1999) |
Geometric Model |
Geometric Model: In principal, the geometric model is similar to well know model of Bruun where the erosion process is the long-term rise in sea level. The analysis involves the upward and landward shift of a triangle, one leg of which corresponds to the elevated water level, and then the landward translation of that triangle and beach profile to account for the extent of erosion and total possible retreat of the dune/beach area. This model was developed based on data collected on the Oregon coast. |
Table 6: Beach Erosion Models
Coastal Management and Analysis System: The COSALC program currently has over 10 years of coastal erosion rate information for St. Kitts and Nevis. Currently, coastal planners use the ‘Profile’ program to manage and display beach profile data. It is recommended that geographic information system (GIS) be used to integrate this data with corresponding spatial information to generate thematic maps, and perform spatial and other advanced analyses. Some examples are highlighted below.
Beach profile data stored in ‘Profile’ is static and no tools are available to users for calculating erosion/accretion rates. Any analysis of beach dynamics (e.g. annual erosion/accretion, sand volume changes) is done manually on an annual basis and presented in reports (e.g. Cambers et. al., 1994, 1995). Routines should be developed that allow users to: a) Identify and locate sensitive beaches with a specified erosion rate; b) Calculate erosion and accretion rates over a specified period for a particular beach or category of beaches; c) Compare erosion and accretion rates between beaches or categories of beaches over a specified period; and d) Calculate beach sand volume changes over a specified period for a particular beach.Erosion/Accretion Data Analysis:
Risk Analysis: This study has highlighted the erosion hazards along the coastline. The next step will be to perform risk analysis. This analysis will look at the combination of the frequency of erosion along the coastline and the potential impacts on coastal development and infrastructure. Routines should be developed to perform these risk analyses.
Setback Analysis: In St. Kitts and Nevis setback distances are typically standardized for all beaches and do not take into account coastal factors (e.g. sea level rise, projected coastline change based on historical data and extreme storm events) and useful life of coastal structure. Routines should be developed for calculating individual setback distance. Cambers (1997; 1998b, 2000a) has used this approach to develop a method for calculating setback distances in Nevis and St. Kitts. However, the method used to calculate coastline changes during a major storm may be taken further. As Marra (1998) points out, empirical observations can be used to predict coastal erosion due to storms but should not be relied on exclusively. He suggests that these empirical observations are best used to confirm results of predictive models, which estimate the maximum erosion, associated with a 25, 50 or 100 year storm. It is recommended that the setback analysis work done by Cambers and Marra be used as an initial guide for developing the setback routine.
Scenarios: Scenarios are excellent tools to study the potential impacts of coastal erosion or implementing coastal planning policies. For example, if setback distance are implemented, this may result in less coastal lands being developed. This may result in Government benefiting from reduced infrastructure costs but on the other hand receiving reduced tax revenues. With scenarios, decision-makers can analyze the impacts of introducing various setback distances and other coastal planning strategies.
Coastal Information Dissemination via the Internet: Communicating coastal erosion hazard and other information (e.g. coastal zone development guidelines) to stakeholders (e.g. government agencies, landowners, environmental NGO’s, potential investors) is essential for ensuring compliance with coastal development regulations and facilitating a cooperative effort for managing the scarce coastal and marine resources. Traditionally, disseminating this type of information has been text-based with limited map support. With advancing GIS-Internet technology, users can now use GIS tools over the Internet to explore coastal map information. It is recommended that GIS and Internet technology be used for the dissemination of coastal information.
Abkowitz, M. (Lecturer in Environmental Risk Management). Personal Communication and Environmental Risk Management Class Notes. Civil Engineering, Vanderbilt University. 2000.
Barrett, A. and Huggins, L. Hurricane Impacts in Nevis. In Coastal regions and small island papers, No. 1, UPR/SGCP-UNESCO, Mayaguez, Puerto Rico. 1997.
Bartlett, D.J. Working on the Frontiers of Science: Applying GIS to the Coastal Zone. In Wright, D. and Bartlett, D.J (editors). Marine and Coastal Geographical Infrmation Systems. Taylor and Francis, London. 2000.
Cambers, G., Coker, V., Daniel, E., Lloyd, P., Simmonds, J. and Williams, P. COSALC I Beach and Coastal Stability in the Lesser Antilles: Analysis of Beach Changes in St. Kitts between 1992 and 1993. COSALC report. 1994.
Cambers, G., Coker, V., Daniel, E., Lloyd, P., Simmonds, J. and Williams, P. COSALC I Beach and Coastal Stability in the Lesser Antilles: Analysis of Beach Changes in St. Kitts between 1992 and 1994. COSALC report. 1995.
________. Hurricane Impacts on Beaches in the eastern Caribbean islands. Coast and Beach Stability in the Caribbean (COSALC) report. 1996.
_________. Planning for Coastline Change: Guidelines for construction setbacks in the Eastern Caribbean Islands. CSI info 4, UNESCO, Paris. 1997
_________. Coping with Beach Erosion. UNESCO Publishing, Paris, France. 1998a.
_________. Planning for Coastline Change: Coastal Development Setback Guidelines in Nevis. COSALC report. 1998b.
_________. Planning for Coastline Change: Coastal Development Setback Guidelines in St. Kitts. COSALC report. 2000a
_________. Annual Beach Erosion Rate Data for St. Kitts and Nevis (unpublished). 2000b.
_________. Coastal Management Consultant: Personal Communication. University of Puerto Rico. 2000c.
Clayton, K. Predicting sea-level rise and managing the consequences. In O’Riordan, T. (editor), Environmental Science for Environmental Management. John Wiley and Sons, New York. 1995.
Davis, R.A. Coasts. Prentice Hall, New Jersy 1996.
Davis, R.A. Beach. In Schwartz (editor). The Encyclopedia of Beaches and Coastal Environments. Hutchinson Ross Pub. Co., Stroudsburg, Penn., pp. 140-141. 1982
Environmental Systems Research Institute (ESRI). ArcView Software Description. www.esri.com. 2000.
Hayes, M.O. Beach Erosion In Clark, J.R. (editor) Coastal Resources Management: Development Case Studies. Renewable Resources Information Series, Coastal Management publications, No. 3. Research Planning Institute, Inc, Columbia, South Carolina. 1985.
International Monetary Fund (IMF). Public Information Notice: IMF Concludes Article IV Consultation with St. Kitts and Nevis. www.imf.org/external/np/sec/pn/2000/pn00104.htm. December, 2000.
James, P. Coastal Management Consultant: Personnel Communication. Fisheries Department, Antigua. 2000.
Komar, P.D., McDougal, W.G., Marra, J.J. and Ruggiero, P. The Rational Analysis of Setback Distances: Applications to the Oregon Coast. In Shore and Beach. Vol. 67, No.1, January 1999.
Komar, P.D. Beach Processes and Sedimentation. Prentice-hall, Upper Saddle River, N.J. 1998.
_________. Beach Processes and Erosion. In Komar, P.D.(editor) Handbook of Coastal Processes and Erosion. CRC Press, Inc. Boca Raton, Florida. 1983.
Kreibel, D.L. Users Manual for Dune Erosion Model: EDUNE. Ocean Engineering Program, US naval Academy, Anapolis. 1994.
Nichols, K. Coastal Management Specialist: Personal Communication. Organization of East Caribbean States, St. Lucia. 2000.
Marra, J.J. Chronic Coastal Natural Hazards Model Overlay Zone. Report completed for the Oregon Department of Land Conservation and Development. 1998.
Opadeyi, J. Development of Digital Elevation Model for Antigua, Barbuda, St. Kitts, and Nevis. 2000 www.oas.org/pgdm/data/dem_rept.htm
Organization of American States (OAS). Post-Georges Disaster Mitigation Project. http://www.oas.org/pgdm/. 2000.
Pethick, J. An Introduction to Coastal Geomorphology. Routledge, New York. 1991.
USAID. Office of U.S. Foreign Disaster Assistance: Annual Report FY. 1998. www.usaid.gov/hum_response/ofda/98annual/stkitts.html.
_________. Hurricane Georges Reconstruction and Recovery in the Eastern Caribbean. 1999. http://hurricane.info.usaid.gov/spoec.html
United States Army Corp of Engineers (USACE). Shore protection manual, Volume 1. Vicksburg: Coastal Engineering Research Center (CERC), Waterways Experiment Station. 1984.
Typically a beach will have two or three beach profile sites. A site will have a reference point from where all measurements are made. The method of collecting beach profile data involves laying out the beach into segments where each segment starts at each break of slope. Initial measurements are made from the reference point. The end point of the profile is the offshore step, near the wave break point where there is a marked step. Figure 1 shows a schematic of a beach profile and its segments. Using ranging poles and an Abney level, the slope of each profile segment is recorded (eg. slope q 1 for profile segment A-B). Ground distance along each profile segment is also recorded (eg. distance d1 for segment A-B). See Figure 1 (page 30).
The beach width and cross-sectional area parameters are computed as follows.
First profile segment A-B
d1 = distance along slope from A to B
h1 = horizontal distance from A to B
v1 = vertical drop for segment A-B
q
1 = angle of slope for segment A-B
A1 = cross-sectional area for segment A-B
h1 = (d1)(cos q
1), v1 = (d1)(sin q
1 )
A1 = 1/2 (h1) (v1)
Second profile segment B-C
d2 = distance along slope from B to C
h2 = horizontal distance from B to C
v2 = vertical drop for segment B-C
q
2 = angle of slope for segment B-C
A2 = cross-sectional area for segment B-C
h2 = (d2)(cos q
2), v2 = (d2)(sin q
2 )
A2 = h2[1/2 d2 + d1]
Total cross-sectional area (A) = A1+ A2+ ... + An
Total beach width (W) = h1+ h2+ ...+ hn
where n= number of profile segments
Figure 1: Beach Profile
|
Mean Annual Beach width St. Kitts 1991-1999 |
||||||||||
|
Site |
Mean Beach Width (m) |
|||||||||
|
1991 |
1992 |
1993 |
1994 |
1995 |
1996 |
1997 |
1998 |
1999 |
||
|
Basseterre East |
30.89 |
34.86 |
33.10 |
32.88 |
33.92 |
38.41 |
41.30 |
37.34 |
ND |
|
|
Basseterre West |
21.40 |
16.38 |
20.62 |
22.91 |
14.59 |
17.92 |
16.62 |
18.28 |
ND |
|
|
New Guinea Bay |
8.00 |
8.91 |
9.20 |
6.67 |
6.84 |
8.84 |
8.47 |
ND |
ND |
|
|
Pump Bay |
25.66 |
24.63 |
23.50 |
23.85 |
15.83* |
14.26 |
21.04 |
32.41* |
27.09 |
|
|
Belle Tete South |
44.13 |
47.76 |
45.21 |
25.70 |
47.53 |
56.73 |
50.54 |
68.64 |
59.77 |
|
|
Belle Tete North |
50.54 |
57.39 |
52.40 |
80.48 |
45.26 |
48.12 |
43.79 |
53.15 |
ND |
|
|
Dieppe Spit West |
26.76 |
26.19 |
26.02 |
24.94 |
20.50 |
20.99 |
21.30 |
18.46 |
ND |
|
|
Dieppe Spit North |
33.52 |
36.38 |
21.23 |
15.36 |
15.62 |
13.91 |
13.68 |
12.82 |
15.56 |
|
|
Dieppe Spit East |
ND |
38.23 |
42.97 |
46.37 |
40.03 |
51.26 |
48.53 |
ND |
40.51 |
|
|
Caines Pasture |
36.11 |
38.61 |
40.80 |
40.10 |
41.19 |
40.17 |
39.99 |
47.49 |
39.86 |
|
|
Sandy Bay |
24.87 |
29.09 |
29.76 |
12.68 |
8.93 |
12.96 |
20.66 |
15.51 |
9.81 |
|
|
Conaree |
30.28 |
30.07 |
30.33 |
30.49 |
31.24 |
29.33 |
29.25 |
28.78 |
30.01 |
|
|
Halfmoon Bay |
62.27 |
53.70 |
53.86 |
53.48 |
51.16 |
47.53 |
Discontinued |
|||
|
North Frigate Bay |
ND |
29.41 |
29.46 |
27.93 |
31.26 |
25.39 |
23.58 |
28.45 |
34.53 |
|
|
North Friars Bay N. |
ND |
67.60 |
78.60 |
77.20 |
61.77 |
53.62 |
58.15 |
65.07 |
42.27 |
|
|
North Friars Bay S. |
53.90 |
52.60 |
45.36 |
33.67 |
57.48 |
41.66 |
41.95 |
45.67 |
52.84 |
|
|
Sand Bank Bay West |
ND |
42.00 |
38.90 |
41.19 |
45.56 |
43.82 |
36.38 |
48.61 |
31.59 |
|
|
Sand Bank Bay East |
ND |
ND |
55.30 |
54.90 |
47.55 |
44.93 |
39.24 |
35.87 |
29.63 |
|
|
Mosquito Bay North |
ND |
19.70 |
22.50 |
16.07 |
19.57 |
16.56 |
16.06 |
19.16 |
17.57 |
|
|
Mosquito Bay South |
ND |
24.40 |
19.90 |
19.37 |
23.51 |
16.03 |
10.92 |
20.79 |
15.67 |
|
|
Cockleshell Bay East |
ND |
9.10 |
7.70 |
8.32 |
11.34 |
14.44 |
11.20 |
12.76 |
11.68 |
|
|
Cockleshell Bay Cen. |
ND |
19.90 |
17.80 |
16.62 |
19.99 |
23.32 |
21.59 17.79* |
19.61 |
ND |
|
|
Cockleshell Bay Wst. |
20.90 |
21.20 |
23.30 |
23.62 |
21.00 |
15.09 |
16.52 |
11.33 |
15.48 |
|
|
Banana Bay East |
23.30 |
21.00 |
22.50 |
21.74 |
19.74 |
24.83 |
29.93 |
27.44 |
19.98 |
|
|
Banana Bay West |
ND |
17.40 |
19.30 |
15.17 |
15.72 |
13.88 |
14.32 |
13.47 |
12.75 |
|
|
Major Bay East |
7.80 |
7.90 |
8.10 |
9.31 |
9.14 |
8.45 |
8.15 |
6.67 |
ND |
|
|
Major Bay West |
20.60 |
20.50 |
22.20 |
22.42 |
15.12 |
10.32 |
13.61 |
10.79 |
7.37 |
|
|
Ballast Bay Central |
ND |
16.90 |
16.60 |
15.85 |
16.65 |
17.37 |
Discontinued |
|||
|
Ballast Bay North |
18.50 |
19.20 |
19.20 |
16.13 |
20.02 |
18.81 |
Discontinued |
|||
|
Whitehouse Bay Cen |
11.50 |
12.20 |
12.00 |
11.68 |
14.00 |
14.29 |
13.70 |
15.98 |
14.99 |
|
|
Whitehouse Bay Nth. |
ND |
13.00 |
13.70 |
12.37 |
18.16 |
20.46 |
13.54 |
12.44 |
15.03 |
|
|
South Friars Bay S. |
ND |
38.00 |
36.40 |
28.72 |
28.80 |
29.63 |
31.68 |
28.45 23.29* |
19.33 |
|
|
South Friars Bay Cen |
ND |
30.80 |
29.10 |
25.08 |
20.14 |
14.75 |
17.58 |
23.48 |
17.52 |
|
|
South Friars Bay N. |
30.60 |
33.60 |
36.50 |
45.13 |
35.02 |
19.73 |
21.69 |
ND |
ND |
|
|
South Frigate Bay |
ND |
25.39 |
24.90 |
23.27 |
24.73 |
25.03 |
24.42 |
26.55* |
24.20 |
|
|
Key: ND- No data |
||||||||||
|
Mean Annual Beach Width Nevis 1988-1999 |
|||||||||||||
|
Site |
Mean annual beach width (m) |
||||||||||||
|
1988 |
1989 |
1990 |
1991 |
1992 |
1993 |
1994 |
1995 |
1996 |
1997 |
1998 |
1999 |
||
|
Gallows Bay South |
35.75 |
31.97 |
14.73 |
19.47 |
16.16 |
11.05 |
20.12 |
21.05* |
11.46 |
12.58 |
13.50* |
14.35 |
|
|
Gallows Bay North |
24.92 |
25.29 |
31.05 |
25.39 |
26.23 |
22.85 |
33.79 |
18.58 |
26.80 |
15.81 |
17.18 18.59* |
16.96 |
|
|
Pinneys Beach Hotel |
23.25 |
27.50 |
16.69 |
14.12* |
11.12 24.58* |
22.04 |
23.04 |
19.83 |
20.12 |
14.97 20.21* |
13.89 |
16.32 |
|
|
Pinneys Beach 3A |
ND |
ND |
ND |
20.88 |
20.52 |
18.80 |
16.83 |
12.12 |
17.11 |
13.46 |
17.70* |
15.24 |
|
|
Pinneys Golden Rock |
32.99 |
33.73 |
29.75 |
31.50 |
28.39 |
22.66 |
27.88 |
23.92 |
24.73 |
25.77 |
24.58 |
20.93 |
|
|
Pinneys Jessup |
30.57 |
27.88 |
16.58 |
22.15* |
24.62 |
22.62 |
26.79 |
25.30 |
25.65* |
23.94 |
20.75 |
24.89 |
|
|
Pinneys Mariners |
27.68 |
26.65 |
20.38 |
11.69 |
18.15 |
19.77 |
15.23 |
18.46 |
28.96 |
34.01 |
49.63 |
49.96 |
|
|
Pinneys Cotton Gr. |
40.91 |
41.97 |
36.85 |
30.93 |
31.34 |
37.40 |
33.72 |
20.00 |
30.24 |
20.82 |
13.04 |
19.29 |
|
|
Cades Bay |
14.14 |
14.66 |
15.85 |
14.40 |
12.98 |
13.95 |
16.06 |
13.59 |
13.85 |
9.79 |
13.82 |
14.09 |
|
|
Mosquito Bay |
13.79 |
14.18 |
15.66 |
15.13 |
14.54 |
15.93 |
15.95 |
18.18 |
23.42 |
19.48 |
19.29 |
24.90 |
|
|
Hurricane Hill |
31.50 |
28.29 |
28.77 |
27.18 |
23.51 |
21.71 |
26.69 |
21.19 |
22.28 |
17.33 |
20.69 |
17.89 |
|
|
Newcastle West |
12.66 |
14.34 |
12.90 |
10.36 |
10.79 |
11.99 |
11.76 |
11.20 |
16.44 |
12.94 |
12.78 17.97* |
19.63 |
|
|
Newcastle Jetty |
23.59 |
30.76 |
30.15 |
28.58 |
22.64 |
23.17 |
18.94 |
18.34 |
23.10 |
13.84 |
19.28* |
12.12 |
|
|
Nisbett West |
26.23 |
32.31 |
26.87 |
26.01 |
23.83 |
21.35 |
25.09 |
22.01 |
21.23 |
14.47 |
15.99 |
18.07 |
|
|
Nisbett East |
23.79 |
23.59 |
21.60 |
18.53 |
15.04 |
16.30 |
17.34 |
15.91 |
11.97 |
6.06 |
8.79 |
13.14 |
|
|
Longhaul Bay |
10.25 |
13.97 |
17.01 |
12.93 |
13.55 |
9.49 |
13.31 |
14.38 |
ND |
11.83* |
14.49 |
17.03 |
|
|
White Bay |
71.67 |
87.21 |
66.91 |
62.81 |
63.25 |
55.48 |
64.02 |
70.25 |
74.05 |
52.91 |
59.49 |
59.83 |
|
|
Indian Castle |
55.90 |
60.33 |
60.00 |
46.75 |
70.61* |
60.21 |
71.15* |
74.46 |
78.49 |
29.27* |
31.86 |
28.91 |
|
|
Key ND- No data |
|||||||||||||
Information to be include on coastal hazard map sheet:
The hazard map itself should be located in the upper three quarters of the map sheet; the map title should be positioned in the top central area of the map, and the map scale on the lower left corner of the upper ¾ of the sheet. Items ii through ix are to be positioned in the lower quarter of the map sheet, with the legend and explanatory text in the left half and items iv, vii – ix in the right half.
A hazard assessment of coastal erosion in St. Kitts and Nevis is to be conducted consistent with current coastal erosion hazard assessment methodologies. The following activities are to be included in this hazard assessment work:
Base Map Data Source for St. Kitts and Nevis GIS layers.
|
St. Kitts Topog raphic Map Scale 1:25,000 Number of sheets 1 Grid British West Indies Projection Transverse Mercator Spheroid Clarke 1880 (Modified) Unit of Measurement Metre Meridian of Origin 62 West of Greenwich Latitude of Origin Equator Scale factor at Origin 0.9995 False Coordinates of Origin 400,000 m Easting; Nil m Northing Contour interval 50feet Series E803 (DOS 343) Edition 1984 |
Nevis Topographic Map Scale 1:25,000 Number of sheets 1 Grid British West Indies Projection Tranverse Mercator Spheroid Clarke 1880 (Modified) Unit of Measurement Metre Meridian of Origin 62 West of Greenwich Latitude of Origin Equator Scale factor at Origin 0.9995 False Coordinates of Origin 400,000 m Easting; Nil m Northing Contour interval 50feet Series E803 (DOS 343) Edition 5 O.S.D. 1984 |