|
Based on the information provided by the operators
in Ecuador, the capacity they use for connecting to the international
Internet backbone is of 12 STM-1; that is to say 1.86 Gbps.
This capacity allows handling the 105.000
connections of switched access and over 28.000 connections of
dedicated access through DSL, Cable MODEM and fiber optic.
The study concludes that Ecuador will require a
minimum capacity of 43 2STM1 in the year 2010, equivalent to 66.2 Gbps.,
for handling the international connectivity of the different services,
in a scenario that would have an average access speed for broadband
connections of 1 Mbps; or of 226 STM-1, equivalent to 33.8, in a more
conservative scenario with an average access speed of 512 Mbps.
The study of Broadband in the Andean Region carried
out by the Association of Telecommunication Undertakings of the Andean
Community, ASETA, in 2005, establishes the following growth rates for
the Internet connections in Ecuador:
|
Expected growth of connections according to projection of
ASETA |
|
|
2.005 |
2.006 |
2.007 |
2.008 |
2.009 |
2.010 |
|
Growth of Narrow bands |
|
17% |
19% |
12% |
8% |
9% |
|
Annual growth Broadband |
|
38% |
64% |
75% |
63% |
51% |
Based on these growth rates and starting from the
amount of links as of December 2005 reported by the operators to
CONATEL, the following connections projection until the year 2010 is
obtained:
|
Internet Connections |
|
|
2.005 |
2.006 |
2.007 |
2.008 |
2.009 |
2.010 |
|
Switched (thousands) |
102 |
119 |
142 |
159 |
172 |
188 |
|
Dedicated (thousands) |
27 |
37 |
61 |
106 |
173 |
262 |
Capacity for Internet:
Considering that the international band width is
one of the critical aspects in the development of the connectivity of
broadband Internet, due to the quality as well as the cost, it is
assumed that the reuse of the international capacity for switched
access is of 10:1, with an access speed of 56 Kbps, which will have no
future modifications because the technological developments are more
focused to the DSL dedicated connections and Cable MODEM.
As regards the dedicated connections, a reuse
factor of 5:1 is estimated, considering the current capacities and its
projected growth, while the access speed will be constantly growing
based on the reduction of the tariff and the larger needs of access
capacity supported by the equipments and the one required by the new
applications and uses of information as are games, video, VoIP on the
established connections.
For the development of social Internet, a reuse
rate of 8:1 is estimated, considering its use hours and types of
applications to be used.
Two estimations are made: The first one, takes into
consideration an evolution of the dedicated connections for reaching
an average band width of 1 Mbpd by dedicated connection in 2010 (Scenario
A) and a more conservative one that estimates that an average speed of
512 Kbps can be reached by dedicated connection in 2010 (Scenario B).
For Scenario A:
|
Average band width and reuse rate |
|
|
2.005 |
2.006 |
2.007 |
2.008 |
2.009 |
2.010 |
|
Switched |
|
|
|
|
|
|
|
Reuse |
10 |
10 |
10 |
10 |
10 |
10 |
|
Average band width (Kbps) |
56 |
56 |
56 |
56 |
56 |
56 |
|
BW Growth |
0% |
0% |
0% |
0% |
0% |
0% |
|
Dedicated |
|
|
|
|
|
|
|
Reuse |
5 |
5 |
5 |
5 |
5 |
5 |
|
Average band width (Kbps) |
177 |
212 |
276 |
413 |
641 |
1025 |
|
BW Growth |
|
20% |
30% |
50% |
55% |
60% |
|
Social Internet |
|
|
|
|
|
|
|
Reuse |
0 |
0 |
8 |
8 |
8 |
8 |
|
Average band width (Kbps) |
0 |
0 |
128 |
192 |
250 |
324 |
|
BW Growth |
|
|
|
50% |
30% |
30% |
Source: World level growth projections
and own estimates.
For Scenario B:
|
Average band width and reuse rate |
|
|
2.005 |
2.006 |
2.007 |
2.008 |
2.009 |
2.010 |
|
Dedicated |
|
|
|
|
|
|
|
Reuse |
5 |
5 |
5 |
5 |
5 |
5 |
|
Average band width (Kbps) |
177 |
212 |
265 |
331 |
414 |
518 |
|
BW Growth |
|
20% |
25% |
25% |
25% |
25% |
Capacity
for International Data:
Notwithstanding the importance of the corporate clients of maintaining
links with their headquarters located in countries different from
Ecuador, the use of international capacity for this type of services
is low, as regards Internet and telephone. Additionally, companies
prefer to use other type of services that allow the optimization of
their infrastructure, for example, the configuration of VPNs on
Internet.
Based on the above, it is estimated that the growth, in band width on
the links currently configured as well as in the amount of connections
for the following five years, will show very low rates and therefore
the needs of international capacity for this type of services will be
very limited in comparison to the needs of capacity for Internet
access.
The
following chart shows a projection of the average band width growth
for international data connection assuming that, based on the
information provided by the operators, the current average is 384 Kbps.
|
Band width use for international data connection |
|
|
2.005 |
2.006 |
2.007 |
2.008 |
2.009 |
2.010 |
|
Average band width (Kbps) |
384 |
403 |
423 |
445 |
467 |
490 |
|
Growth |
|
5% |
5% |
5% |
5% |
5% |
Starting from a number of dedicated links at the end of 2005 and low
growth rates for the next five years, the following number of
dedicated links for international connection was obtained:
|
International data dedicated links |
|
|
2.005 |
2.006 |
2.007 |
2.008 |
2.009 |
2.010 |
|
Dedicated links |
640 |
672 |
706 |
741 |
778 |
817 |
|
Growth |
|
5% |
5% |
5% |
5% |
5% |
Capacity for Voice services.
Voice traffic based on traditional TDM switching by Incumbent
operators is falling to an annual rate of 5%, as was shown by
international analysts and ratified by comparing the total figures for
Ecuador in 2005 with the figures for 2004 (1.216 billion minutes in
2005 and 1.258 billion in 2004). This tendency is irreversible and
obeys to the fact that IP telephony technology is more mature every
day and is coming out at rock-bottom prices, especially in the
clandestine traffic modality. Incumbent operators must accept this
technology in order to offset clandestine traffic and avoid the income
loss derived from this. As incumbent operators begin to accept the
technology and the countries draw up clear-cut regulations for IP
telephony, it will be better positioned in the market.
Taking the above into account, we have anticipated the traditional TDM
telephone traffic with an annual fall of 5% year after year, until
2010. On the other hand, for IP telephony traffic we estimated the
following large growth rates during the period of the study:
|
Year |
2006 |
2007 |
2008 |
2009 |
2010 |
|
Growth |
20% |
25% |
30% |
35% |
40% |
However, in spite of the accumulated high growth rates during the
period observed, IP telephony does not require large transport
capacity compared to the compression technology it uses, which is one
of its most attractive aspects.
The
STM-1s capacity required to efficiently transport telephone traffic
over the IP modality, where we anticipated the use of G.729 coding and
silence detection is shown below.
|
Year |
2006 |
2007 |
2008 |
2009 |
2010 |
|
VoIP STM-1s |
0.14 |
0.17 |
0.22 |
0.29 |
0.41 |
For
clarification purposes, this traffic modality refers to finished
traffic in duly authorized operators. There is another type of traffic
which does not end at PSTN network telephone devices but at users´
terminals or PCs, its capacity being basically the internet capacity.
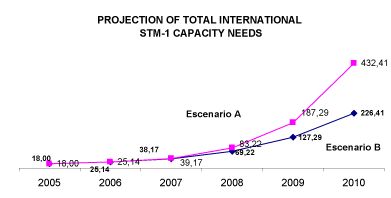
Results of the Projection of the International Capacity
Needs:
Based on the above considerations, the total projection of the
international band width needs, with the estimated growth year after
year until 2010, is as follows:
Scenario A:
Total International STM-1s Capacity
|
|
2005 |
2006 |
2007 |
2008 |
2009 |
2010 |
|
Internet |
11 |
17 |
32 |
75 |
179 |
424 |
|
Data |
2 |
2 |
2 |
3 |
3 |
3 |
|
Voice |
5 |
6.14 |
5.17 |
5.22 |
5.29 |
5.41 |
|
Total |
18 |
25.14 |
39.17 |
83.22 |
187.29 |
432.41 |
Scenario B:
Total International STM-1s Capacity
|
|
2005 |
2006 |
2007 |
2008 |
2009 |
2010 |
|
Internet |
11 |
17 |
31 |
61 |
119 |
218 |
|
Data |
2 |
2 |
2 |
3 |
3 |
3 |
|
Voice |
5 |
6.14 |
5.17 |
5.22 |
5.29 |
5.41 |
|
Total |
18 |
25.14 |
38.17 |
69.22 |
127.29 |
226.41 |
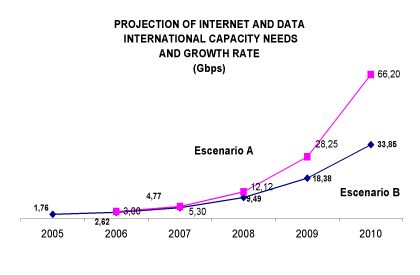
<<Selection in Document>>The
above projection allows to determine the international band width
needs for Internet and Data services, in Giga bits per second and
their growth rate for the period of study until 2010 in Ecuador.
Scenario A : Internet and Data international capacity and growth
rate
|
|
2005 |
2006 |
2007 |
2008 |
2009 |
2010 |
|
Gbps |
1,76 |
3.0 |
5.3 |
12.12 |
28.25 |
66.2 |
|
% Growth |
|
48% |
76.6% |
128.6% |
132.2% |
134% |
Scenario B: Internet and Data international capacity and growth
rate
|
|
2.005 |
2.006 |
2.007 |
2.008 |
2.009 |
2.010 |
|
Gbps |
1,76 |
2,62 |
4,77 |
9,49 |
18,38 |
33,85 |
|
Growth |
|
49% |
82% |
99% |
94% |
84% |
|
Additional Information: Document published as
CCP.I-TEL/doc. 882/06.
|
|

 Current and future
international capacity of Ecuador (2006 - 2010
Current and future
international capacity of Ecuador (2006 - 2010