Cada año el Secretario General de la OEA publica una Propuesta de Programa Presupuesto para el siguiente año calendario. La Asamblea General de la OEA se reúne en Sesión Extraordinaria y aprueba el Programa Presupuesto. Encuentre aquí esos documentos desde 1998 a 2013.
Cada año en abril la Junta de Auditores Externos publica un informe con los resultados financieros del año anterior. Encuentre aquí los informes de los años 1996-2016.
Aproximadamente seis semanas después del final de cada semestre, la OEA publica un Informe Semestral sobre Gestión de Recursos y Desempeño, que desde 2013 incluye informes sobre resultados programáticos. Los textos completos pueden encontrarse aquí.
Aquí encontrará datos de Recursos Humanos de la OEA, incluyendo la estructura organizacional y el personal de cada unidad organizacional, puestos vacantes y contratos por resultados.
La OEA ejecuta una variedad de proyectos que son financiados por donantes. Los informes de evaluación son encargados por los donantes. Véalos aquí.
El Inspector General presenta al Secretario General informes relativos a auditorías, investigaciones, e inspecciones que realice. Estos informes están a disposición del Consejo Permanente. Más información puede encontrarse aquí.
La OEA ha discutido por varios años el tema de bienes inmuebles, el financiamiento requerido para mantenimiento y reparaciones, y el mantenimiento diferido de sus edificios históricos. La Secretaría General ha presentado una serie de propuestas con una variedad de opciones para financiarlos. El documento más reciente que refleja el estado de la Estrategia es CP/CAAP-32/13 rev. 4.
Aquí encontrará información relacionada con las operaciones de compra de la SG/OEA, incluyendo una lista de avisos de contratación y ofertas formales, enlaces a los reportes de contratos y a los informes de control de medidas de viaje, las reglas y reglamentos de contratación aplicables, y la formación y cualidades del personal de compras.
El Tesorero de la OEA certifica los estados financieros de todos los fondos administrados por la SG/OEA. Aquí encontrará los más recientes informes financieros con propósito general para los principales fondos de la OEA, así como los Informes Financieros Trimestrales (IFTs) de la OEA.
Todos los años la SG/OEA publica el Plan Operativo Anual formulada por todas las áreas de la Organización. Este documento es utilizado como ayuda en la formulación del programa presupuesto anual y como seguimiento a los mandatos institucionales.
Aquí encontrará los documentos relacionados con el diseño, elaboración y aprobación del Plan Estratégico OEA 2016-2020.
Seguridad Pública en las Américas
Seguridad Pública en las Américas
Seguridad Pública en las Américas
Seguridad Pública en las Américas
Seguridad Pública en las Américas
Seguridad Pública en las Américas
Seguridad Pública en las Américas
Seguridad Pública en las Américas
Seguridad Pública en las Américas
Seguridad Pública en las Américas
Seguridad Pública en las Américas
¿Qué hacemos?
El Departamento de Seguridad Pública (DSP) fue creado en 2005 con el propósito de apoyar los esfuerzos de los Estados Miembros en la evaluación, prevención, diagnóstico, abordaje y respuesta a las amenazas (tradicionales, nuevas y emergentes) que enfrenta la seguridad pública en los países de las Américas.
El DSP prioriza su trabajo en función de los mandatos y recomendaciones que emanan de la Asamblea General, la Reunión de Ministros en Materia de Seguridad Pública (y sus Grupos Técnicos Subsidiarios), las Reuniones de Autoridades Nacionales y la Comisión de Seguridad Hemisférica del Consejo Permanente.
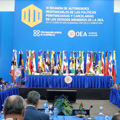
Recomendaciones de la Cuarta Reunión de Autoridades Responsables de las Políticas Penitenciarias y Carcelarias de los Estados Miembros de la OEA
República Dominicana,
3 y 4 de febrero de 2020
Recomendaciones de la Segunda Reunión del Grupo Técnico Subsidiario sobre la Prevención de la Delincuencia, la Violencia y la Inseguridad
5 de septiembre de 2019
Propuestas de Consensos Alcanzados en el “Seminario Internacional sobre Mecanismos y Herramientas de Cooperación sobre los Servicios de Emergencia en la Región”
26 de abril de 2019
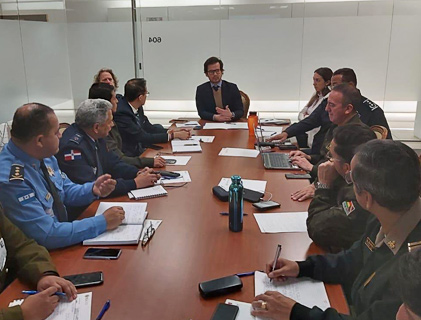
La presente iniciativa, Fortalecimiento del acceso a justicia para las víctimas de delitos en El Salvador, Honduras, Guatemala y Republica Dominicana – Fase 2, da continuidad a los esfuerzos de la OEA para mejorar los servicios de asistencia a víctimas de delito y violencia.
Este documento del Grupo Técnico Subsidiario sobre los Sistemas de Emergencia y Seguridad (GTS-SES), intenta sistematizar, presentar y compartir las estrategias, herramientas y acciones que hubieran resultado efectivas en el enfrentamiento de la pandemia por COVID-19.
Plan de Acción Hemisférico para Orientar la Elaboración de Políticas Públicas de Prevención y Reducción del Homicidio Intencional (2019).
Disponible en: Español |
English |
Português |
Français
Nuestros esfuerzos se concentran en 5 grandes áreas temáticas:
Prevención y reducción de la violencia y el delito.
Reforma de las instituciones policiales y profesionalización del personal policial.
Reforma de las instituciones penitenciarias, reinserción de los privados de libertad y profesionalización del personal penitenciario.
Control y reducción de la fabricación y el tráfico ilícito de armas de fuego, municiones, explosivos y otros materiales relacionados.
Neutralización de campos minados, desactivación y destrucción de minas terrestres, concientización de los riesgos y el impacto de las minas, y asistencia a las víctimas.
El DSP desarrolla esas 5 áreas temáticas en base a 3 líneas de acción:
Brinda asistencia técnica.
Contribuye a la elaboración e implementación de instrumentos y marcos programáticos.
Fomenta la cooperación internacional y el intercambio horizontal.
¿Cuáles son los requisitos para postular?
Los requisitos para postular son:
Tener un promedio de notas de 3.0 sobre 4.0 en escala americana (o equivalente según cada país. Esto significa estar en el 25% superior de su curso).
Si bien no es requisito ser estudiante al momento de postular, aquellos que lo sean deben estar completando al menos su segundo año de estudios de pregrado.
Manejar dos de los cuatro idiomas oficiales de la OEA (español, inglés, francés, y portugués).
Documentos que se deben adjuntar al formulario de postulación:
Dos cartas de recomendación, una preferiblemente de un profesor dentro de tu área de especialización. La segunda carta de un empleador u otro profesor. Incluir información de contacto (teléfono y correo electrónico).
Historial de calificaciones de la universidad o institución de educación superior. (Notas académicas).
Si la pasantía será acreditada por tu institución académica, adjuntar documento oficial de dicha institución..
Currículum Vitae con Carta de Presentación/Hoja de Vida. Nota! Hoja de vida (CV) con foto no será aceptada y descalificará tu aplicación.
Las cartas de recomendación que no puedan ser entregadas directamente al estudiante, pueden ser enviadas a [email protected].
Calificaciones: Por favor NO enviar copia de tu certificado de grado. Estudiantes que tengan acceso a calificaciones no oficiales, pueden adjuntar una copia en el Formato de Aplicación. Asegúrate de enviar por correo la versión oficial a la siguiente dirección: 1889 F Street NW, Washington, DC, 20006 o electrónicamente al correo electrónico mencionado anteriormente.
Aplicaciones incompletas no serán revisadas hasta que el Departamento de Recursos Humanos de la OEA cuente con todos los documentos requeridos.

 Recomendaciones de la Cuarta Reunión de Autoridades Responsables de las Políticas Penitenciarias y Carcelarias de los Estados Miembros de la OEA
 Recomendaciones de la Segunda Reunión del Grupo Técnico Subsidiario sobre la Prevención de la Delincuencia, la Violencia y la Inseguridad
 Propuestas de Consensos Alcanzados en el “Seminario Internacional sobre Mecanismos y Herramientas de Cooperación sobre los Servicios de Emergencia en la Región”
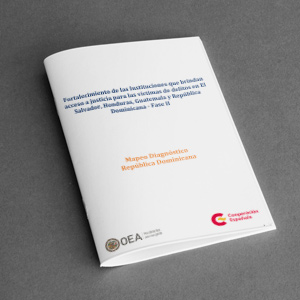 La presente iniciativa, Fortalecimiento del acceso a justicia para las víctimas de delitos en El Salvador, Honduras, Guatemala y Republica Dominicana – Fase 2, da continuidad a los esfuerzos de la OEA para mejorar los servicios de asistencia a víctimas de delito y violencia.
 Informe de Progreso II Plan de Trabajo para Combatir la Trata de Personas en el Hemisferio Occidental 2015-2018.