Caribbean Disaster
Mitigation Project
Implemented by the Organization of American States
Unit of Sustainable Development and Environment
for the USAID Office of Foreign Disaster Assistance and the Caribbean Regional Program
Caribbean Disaster
Mitigation Project |
This guide was produced by the Caribbean Institute for Meteorology and Hydrology for use at the TAOS Users Workshop which was held on July 28 and 29, 1999 at the Institute.
The Guide is set out in two parts. The first part is an overview of the menus, in which each menu option is described briefly. In the second part a more detailed description of each menu option is presented as the user is guided through the use of the menus to extract, edit, and run historical storm; setup and run real time storms and MEOWs.
CIMH, July 1999
Reference: Watson, C., 1998: TAOSmenu Program Manual

Map Limits: Map viewpoint limits
Gridlines: Set Latitude/Longitude lines
Print: Print current screen display to printer
Save as Bitmap: Save current screen display as a bitmap file

Set Hist. Params: Select historical storm, search parameters
View Historical: Views historical meeting search criteria

Select Storm: Select a save storm as active storm
Create New Storm: Create a new storm track
Delete Storm: Delete saved storm track
Manual Edit: Manually edit a storm track
Parse Advisory: Edit a NHC advisory to extract track data
Draw Active Track: Display track of active storm
Forecast Track: Display 72 hr official NHC forecast track
CLIPER/SHIFOR: Run forecast track and intensity model

Edit HGLOCS: Enter or edit locations for hydrograph output
Set Run Options: Select model run parameters
Edit Run Track: Edit track file and run parameters
Run: Run model
View Hydrograph Summary: View the summary output for hydrograph locations
MEOW: Enter MEOW generation parameters

GrADS Menu: Display maximum surge/wind output
GrADS Raw: Manually run GrADS scripts
GV32 GrADS Viewer: 32 bit viewer
View HG Graphs: Select and view hydrographs
The map display commands control such areas as the map extent, background vector map, and gridlines. In addition, this submenu allows the user to print maps to any installed printer driver, or save maps as bitmaps
Map LimitsThe TAOSmenu map viewport initialises to the last view used. To change the region displayed use the MAP LIMITS command (Left click on the Map menu and select Map Limits)
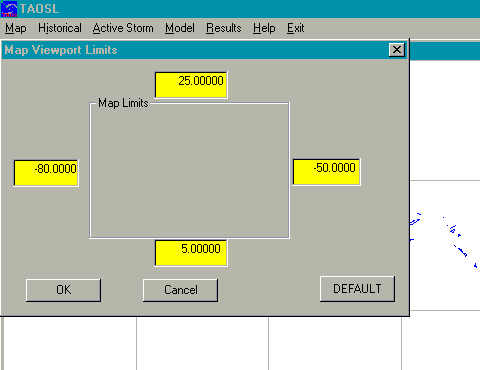
The dialogue box below will appear allowing the user to specify a bounding box for map display. Note that west longitudes are always entered as negative numbers in TAOS menu: -80.0 is 80 degrees west longitude. The system will adjust the right hand side to maximise the viewing area, based on the vertical dimensions given.
Grid Lines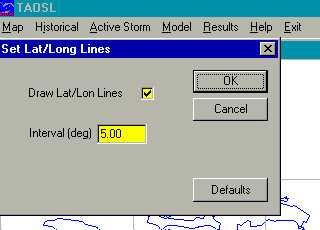
By default, TAOSmenu draws latitude and longitude grid lines every 5 degrees. To change the existing gridlines: Left click on the Map menu and select Map Gridlines
The drawing of Grid lines may be disabled, or the interval changed.
Printing Maps and other displaysMaps may be printed on any installed printer via the MAP/PRINT command. A dialogue box appears which allows the user to select the printer, and change the settings for the printer (such as landscape mode, colour modes, paper source, etc.)
Saving Maps as BitmapsThe map view may be saved as a windows bitmap via the MAP/SAVE AS BITMAP command. This allows graphics to be inserted in to other Windows based programs or exported to graphics packages. A dialogue box will appear to allow the user to change the directory the bitmap is stored in, and specify the name for the bitmap.
Historical Storms and AnalysisThe Historical menu section allows the user to display, select, and analyse historical storms using "best fit" track data from the National Hurricane Center, the Joint Typhoon Warning Center, and other agencies.
Set Historical Parameters(Left click on Historical Storms and select Set Hist. Params)
The Set Historical Parameters dialogue box allows the user the set the parameters used to display historical storms.
Note that these are inclusive: in the dialogue shown below, all storms from 1 Jan 1886 to 31 Dec 1999 would be shown.
Setting the ‘start month’ to 6 would display all storms from 1 June 1886 to 31 Dec 1999. Likewise, setting the lowest wind to 64 knots would only display storms track segments whose winds were from 64 to 200 knots.
Be aware that the databases for some regions of the world do not go back as far in time as others do. The current databases are:
(Select View Historical from the Historical menu)
The Historical menu choice will display historical storm tracks in the current map window, according to the settings set using Set. Historical Params. Positions are denoted by a square at 6-hour intervals. Hurricane force winds are shown in red; Tropical Storm force in yellow. Note that if the map window or parameters are changed, the screen is not automatically redrawn. This is because displaying all historical storms can take some time; therefore drawing historical storm tracks is only done on the explicit command of the user.
Mouse Commands
After the historical storm tracks are drawn, the mouse becomes active in the map window to query or select a historical storm. The mouse functions are:
Left Click: A left click on a storm position (the squares located on the tracks) will display the storm data at the position selected. The date, time, latitude, longitude, wind speed and, if available, central pressure, are displayed.
Right Click: A right click on a storm position displays the data for that position, and gives the user the option of extracting the selected storm track. If the user chooses to extract the storm, the data for that storm will be written out to a file and the storm will become the active storm

The storm will be stored in a file with the first 8 letters of the storm name.
Caution: for storms with no name, or storms with identical names, extracting a new storm will overwrite any existing active storm track file with the same name! In other words, extracting a "Not Named" storm from 1912 will overwrite a previously extracted "Not Named" storm from 1887. Likewise, extracting "Bob" from 1992 will overwrite a "Bob" extracted from 1988. It is a good practice to immediately rename a historical storm to a meaningful file name using the Storms/Rename function before working with it to avoid confusion.
Once a historical track has been extracted and made the active storm, it is possible to edit the track to a smaller size to run the surge model on the reduced track.

In order to accomplish this, select Active Storm/Manual Edit. This function individual track positions to be entered, edited, or deleted. The dialogue box below is displayed on entry to the manual edit.
Most of the fields are self-explanatory. As with all entries in TAOSmenu, west longitudes are entered as negative numbers; in this case, -67.7 is 67.7 degrees west. Navigation buttons are available in the lower right hand portion of the box to jump to the first, last, next and previous entries.
The DELETE button on the window is used to delete individual storm positions. Each deleted position is marked with an ‘x". Starting at one end the desired positions are deleted. Using the jump buttons (First/Last) move to the other end of the track and repeat the steps until the desired positions are deleted.
Note that as each position is deleted, the position numbers in the upper left hand of the window changes.
Once editing is satisfactorily completed, select the Done button and the Save Edits prompt dialogue window appears as seen below. Click Yes to save changes and exit.
The selected saved track is shown below.

Note that this editing of the track does not affect the original track files as this track is saved in a separate file.
The TAOS model uses point locations to track the time history of model outputs. In addition these locations, known as Hydrographs, are locations detailed time histories of model outputs are output.
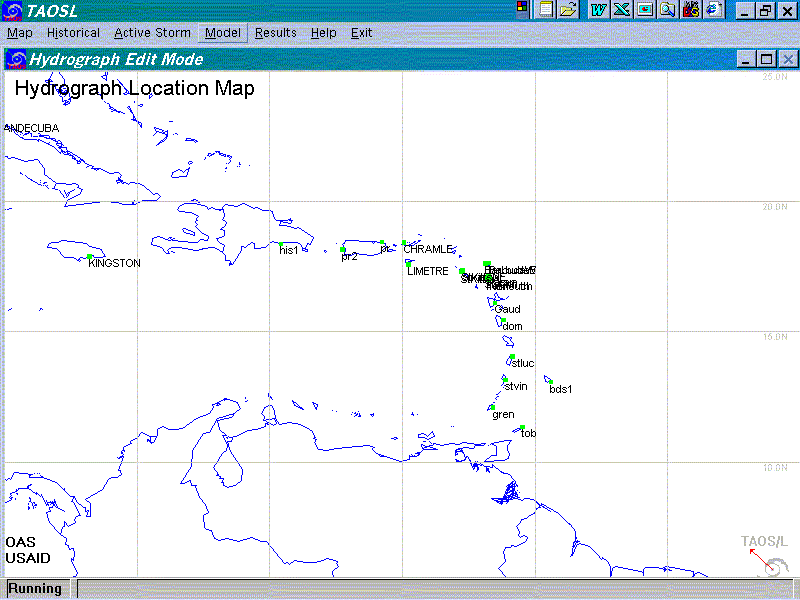
Editing Model/Edit HGLOCS on the main menu bar enters Hydrograph edit mode. The locations of existing hydrographs are displayed on the map area. Locations in the water are coded green, while land locations are coded red.
The mouse is used to enter and edit hydrographs. Clicking the left button will add a new hydrograph if the location selected is not near an existing hydrograph, or edit an existing hydrograph. In either case, the hydrograph edit box is displayed.
For a new hydrograph, the location of the hydrograph will be the latitude and longitude where the mouse was clicked. The user may enter more exact coordinates if available, such as for a tide gauge or facility for which they are available. Hydrograph names are limited to 10 characters.
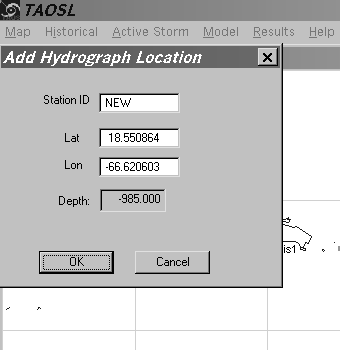
The water depth (or land height) will be displayed if available. This is the terrain height or depth at the model grid point for the specified lat/lon, for the currently loaded DTM.
Running ModelOnce a storm has been selected, be it a historical storm, real time event, or hypothetical exercise, a similar process is followed to run the TAOS storm hazard model and display the results. The Model menu allows the user to configure the desired parameters for a given TAOS run.
A storm may be selected for a model run via one of three processes. First, clicking the right mouse button on a historical storm and extracting that storm selects it. Second, a previously extracted, created, or parsed (from an advisory) storm may be selected from either the menu commands. These commands pull up a menu of existing storm files. Finally, the "Active Storm/Parse Advisory" command selects the most recent storm in the advisory file. Once a storm is selected, the user proceeds to the Model/Set Run Options command.
Setting Run OptionSelect Set Run Options from the Model menu. A typical Model Run Parameters dialogue box is shown below.
In local runs, the "Job Name" is displayed in GrADS script files and ArcVew project files created by TAOS
Most of the model physics options are self-explanatory. The "Do Distant Wave" calculation will compute wave propagation and decay to each hydrograph location for the storm run.
The "Select Data Base" section will display the available data bases. Highlight the appropriate data base which will be copied to the working directory. This operation may be done even with no storm selected in order to have the proper database for determining the water depth/land height at hydrographs.
The run/output options define several key areas. Track Overlay/Back-Track causes the model to check for prior model outputs at each cell. This should be enabled for tracks which double back upon themselves; otherwise, only the maxima from the most recent ‘pass’ by the storm will be recorded. Initialise data bases causes the model to clear the outputs prior to commencement of the model run. This should be enabled (checked) for regular runs and disabled (unchecked) for MEOWS.
The Projected Track Source allows the user to select from the official forecast or one of the available track models for '‘future’ storm positions. Do not use the built-in track models to attempt to second-guess official storm track guidance. They are provided for exercise and experimental use only. In general ‘No Projected Track’ should be selected as shown in the above figure.
In GIS Output Options window select the appropriate file types to generate. Idrisi document files and GrADS control files (the binary files created by TAOS) are directly readable by both Idrisi and GrADS with the proper header files.
MEOW RunsIt is first necessary select the Run Model Parameters as described above, selecting the appropriate options as outlines. Remember that the Annualise Data Bases option MUST be disabled.
Next select the MEOW Generation Parameters menu. This allows the user to enter the information necessary to generate a Maximum Envelope of Wind/Water for a given location. A dialogue box (as seen below) pops up for the user to enter information required for the MEOW run.
The Location is the latitude and longitude of the centre of the study area. The lateral distance, in nautical miles, is how far either side of the central lat/lon point to run storms. Make sure this extends far enough either side to completely cover the area of interest, but be aware that large regions can take considerable time to run.
The Storm Characteristics section allows the user to define the type of storm to create the MEOW for. The Max Wind and Forward Speed values are in knots, while the Radius of Max Wind is in nautical miles. The heading is the compass heading in degrees; for example, 270 is west, 315 is northwest. A complete dialogue box is shown above.
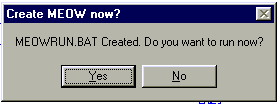
Once this entry dialogue box is completed, select OK to close the menu box. The user is then given the option to run the MEOW. If satisfied, click Yes and the programme will be executed.
| CDMP home page: http://www.oas.org/en/cdmp/ | Project Contacts | Page Last Updated: 20 April 2001 |