

Report prepared by Smith Warner International Ltd., Kingston Jamaica

This executive summary is extracted from the full report entitled Storm Surge Mapping for Montego Bay, Jamaica.
The General Secretariat of the Organization of American States (OAS), in collaboration with the USAID, has sponsored the Caribbean Disaster Mitigation Project (CDMP). As part of this CDMP, a storm hazard pilot project was developed for Montego Bay. The intention of this project was to fine-tune the surge computation and analysis procedures, so that these could be used with confidence in other countries of the Caribbean. In addition, present regulatory and risk assessment practices were evaluated in the light of the predicted storm surge findings.
At the start of the project, a computer model was used to give storm surge predictions for Montego Bay. Specifically, the output from the model included:
The methodology for the computation of storm surge, and the manipulation and interpretation of this data, has subsequently been subjected to a detailed review process. This has resulted in the development of a well-documented approach to storm surge computation, which has been aided by the input of Professors Robert Sorensen and Mark Johnson (of Lehigh University and University of Central Florida respectively) and which has been accepted by the engineering regulatory body in Jamaica. It is believed that the methodology proposed may now be applied with confidence throughout the Caribbean region.
This report forms the final document within the Montego Bay Storm Hazard Project. Three main components have been included. The first is the recommendation for a policy framework, for the use of storm hazard information in Jamaica. In developing this policy framework, an assessment has been made of the current practice regarding the use of hazard information by planners, engineers, and the insurance industry.
The second part of the report includes a set of guidelines for the computation, interpretation, use and presentation of storm hazard information. As part of these guidelines, some basic definitions for storm surge have been made.
The third section of the report gives a description of a case study that was undertaken for Doctor’s Cave in Montego Bay. Within this section, the storm surge models used, have been described.
Finally, the report includes a description of the entire project development, including papers presented at the October 1997 Technical Workshop. These have been presented as Appendix 1.
Current Practices and Regulatory ApproachIn investigating the existing policy framework for storm hazard computation and analysis, a review was made of current practices and the regulatory approach to risk. Under this category, design practices advocated by the Jamaica Institution of Engineers were examined. These revealed well defined design criteria for: wind loading on buildings (using a 1 in 50 year return period event); earthquake loading using the Uniform Building Code approach; and flood levels in drainage works (with return periods ranging from 1 in 2 years for culverts, up to 1 in 50 years for major flood control works).
The procedures employed by the Office of Disaster Preparedness and Emergency Management (ODPEM) were also examined. It was determined that ODPEM’s primary goals, of public education and emergency management, could be greatly enhanced by the acquisition of appropriately scaled mapping. This mapping should ideally be at a scale detailed enough to show infrastructure. Storm surge elevations for varying return periods should then be superimposed onto this base mapping.
Insurance industry practices and needs were then examined. It was assessed that in order to improve the risk quality of its insurance portfolios, it was essential for the industry to develop an in-depth knowledge of the contributors to this risk. Information that was considered to be important for this assessment included:
The present regulations in Jamaica regarding set-back of infrastructure from the mean water line are presented in terms of foreshore slope and are not related to actual risk occurrence. The review carried out of the Town Planning Department regulations and practices clearly indicates the urgent need for revision of these setback regulations, to provide a clear linkage between setback limits and acceptable risk. One prerequisite for this type of approach is the adoption of an acceptable return period that will provide adequate protection against an acceptable level of risk. Recognizing this need, the suggestion has been put forward that the 1 in 25 year return period be adopted by the regulatory planning agencies. Given the adoption of this level of risk, the computed surge elevation may then be drawn onto a suitably scaled base map. From this superposition, information may then be obtained regarding the vulnerability of infrastructure within the coastal zone. In addition, it has been recommended that the Town Planning Department maintain a mandatory minimum setback from the HWM, of 15 metres. This minimum setback is intended to incorporate safety considerations for both cliff-type shorelines and also for erosion considerations for beach-type shorelines.
Finally, as no appropriate code presently exists for the estimation of wave loading in the landward storm surge area, guidelines for the computation of wave heights at the shoreline have also been put forward.
Storm Surge DefinitionsThe actual components of storm surge have been defined as being the sum of three primary components:
These three components contribute to a static water level, which therefore does not include wave run-up, or the crest elevation of the wave above the mean water level. In addition, in the computation of storm surge, it is important to consider tidal variations and also long term sea level rise. For this latter component, a UNEP recommended rate of sea level rise of 5 mm/year is proposed.
Analysis and Presentation of DataOnce storm surge values have been computed for the long-term database, these must then be subjected to a suitable statistical analysis. From this analysis, it will be possible to estimate storm surge corresponding to a variety of return periods. Two statistical methods have been presented for handling hurricane/storm surge data. The first method is an Annual Maximum Method, which requires the computation of a maximum value of storm surge for each year of record. The second method is a Peak Over Threshold Method, which requires the identification of storms passing within a user-specified distance from the location of interest. Results from each method were found to be very similar for the more extreme events (e.g. over 1 in 25 years), but the Peak Over Threshold method resulted in higher value predictions for more frequent events.
The visual presentation of this data has been described in the report, and the following steps are proposed:
It is recommended that a rational approach to the regulation of setbacks should be implemented. These setbacks need to be based on actual statistical risk, in order to provide a consistent means of protection along an island’s shoreline. The legal mechanism for this approach would be through Development Orders, which should include the demarcation of a flood line. The main drawback to the implementation of this approach pertains primarily to the requirement that storm surge data must first be generated for the entire coastal zone (in a lateral sense), and appropriate mapping (minimum scale of 1:5000) must be available.
Engineering considerations within this zone include the following:
Finally, for the proper application of emergency management procedures, it is essential for these agencies to have access to mapping showing maximum inundation limits corresponding to varying categories of storms (in accordance with the Saffir Simpson scale). This mapping may then be used to identify the most vulnerable infrastructure, and as well, to estimate the number of people who may be threatened by flooding, for a particular category of tropical storm or hurricane.
Results of Case StudyA case study was carried out for the Montego Bay area, and in particular at Doctors Cave. Computation of storm surge was carried out using both the TAOS model with an annual maxima approach, as well as the generic model, with a peak-over-threshold approach. These analyses gave the following results:
1. For the TAOS/Annual Maxima approach:
Montego Bay Storm Surge (m) using 2-Parameter Weibull Distribution (Doctors Cave)
Estimate/Confidence Limit |
Return Period (years) |
|||
10 |
25 |
50 |
100 |
|
| MLE | 0.97 |
1.56 |
2.07 |
2.61 |
| 90% limit | 1.15 |
1.90 |
2.56 |
3.28 |
| 95% limit | 1.20 |
2.04 |
2.79 |
3.62 |
| 99% limit | 1.34 |
2.28 |
3.11 |
4.06 |
2. For the Alternative/Peak-Over-Threshold approach:
Doctor's Cave Storm Surge (m) using Weibull Distribution k=1.4
Estimate/Confidence Limit |
Return Period (years) |
|||
10 |
25 |
50 |
100 |
|
| MLE | 1.7 |
2.1 |
2.4 |
2.7 |
| 90% limit | 1.9 |
2.4 |
2.8 |
3.1 |
| 95% limit | 2.0 |
2.5 |
2.8 |
3.2 |
| 99% limit | 2.0 |
2.6 |
3.0 |
3.3 |
Using the alternative approach, storm surge values for varying return periods were also computed for the Montego Bay Airport, the Montego River outfall and the Montego Freeport. The 1 in 25 year return period (MLE) surge computed at these locations were 1.6 m, 1.7 m and 2.5 m respectively, indicating a range of almost 1.0 metre depending on the exact location.
In the presentation of the computed data, a base map was prepared from 1:15,000 scale 1991 colour photography of the area. Ortho-rectification of these images was achieved by following a novel process, whereby the available data was used to produce a detailed base map image at a relatively low cost. The ortho-rectification process involved the following steps.
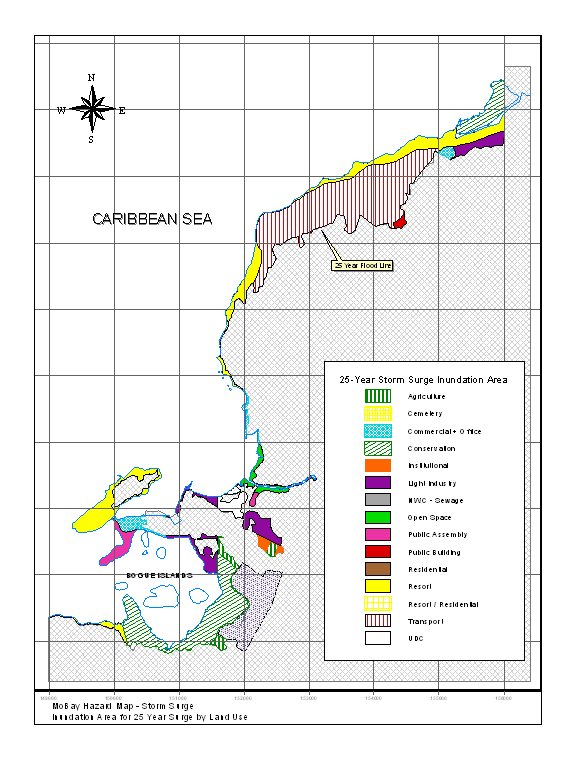
The computed storm surge results for the case study have been mapped within a GIS, which has been used to evaluate infrastructure and population areas at risk. The coastal zone of the Montego Bay area is planned for resort, resort/residential, transportation, conservation, commercial/office, institutional, light industry, open space, public assembly, public buildings, agriculture and residential uses. Mapping of the 1 in 25 year return period surge (see Figure ES-1) indicates that of a total land area of 1400 hectares within this zone, approximately 480 hectares (or 34%) will be impacted by storm surge. In addition, it was found that land areas associated with conservation, resort and transportation (airport) were the most seriously affected.
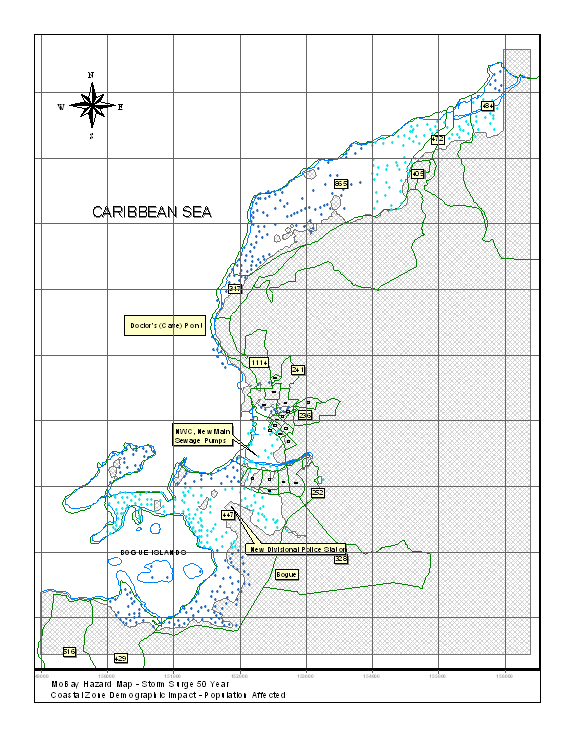
The population within the coastal zone was obtained from the 1991 Census data, to be 16, 626. Significant growth of this number is not expected, since the area is already well developed and there is little provision for new housing other than through the redevelopment of existing housing lands. Mapping of the storm surge shows that the 1 in 25 year event will not have major impacts on this population. By contrast, the 1 in 50 year event is shown to have significantly more impact and would require mitigation planning by ODPEM. The physical problems likely to be experienced by these communities during the close passage of hurricanes are attributable to low level flooding and public health risks associated with contaminated water.
Finally, the mapping of storm surge showed that some critical infrastructure would be threatened during the passage of a storm (see Figure ES-2). These included: the new Divisional Police Station; the new main NWC sewage pump station; and the Sangster International Airport. Special emergency management plans will need to be formulated to ensure that as soon as the elevated waters subside, these facilities may be returned to active service. In addition, the banks of the North and South Gullies, and the Montego River, are likely to be overtopped, as elevated water levels at sea will affect the flood regimes in these watercourses.
This executive summary is extracted from the full report entitled Storm Surge Mapping for Montego Bay, Jamaica.
| CDMP home page: http://www.oas.org/en/cdmp/ | Project Contacts | Page Last Updated: 20 April 2001 |