
Report prepared by Mark E. Johnson and Charles C. Watson, Jr.
AbstractHurricane perils include the physical phenomena of wind, wave and storm surge—effects posing significant threats to life and property in the Caribbean. The potential impacts of these perils and their frequency are of paramount importance in structural design for buildings, land use planning (such as siting hospitals, housing or recreational facilities), emergency management (evacuation preparedness), hazard mitigation, and insurance applications. A comprehensive and coherent return period estimation methodology is implemented for each of the three hurricane perils. The methodology is applicable to the entire Caribbean and is sufficiently flexible to accommodate superior localized digital terrain mapping (DTM) information. In the absence of such refined information, the full Caribbean is assessed for hurricane hazards at a resolution of thirty arc-seconds (approximately 930 meters). The methodology includes both best estimates of effects and upper prediction limits that capture the inherent uncertainty in forecasts. Results consist of return period maps for the entire region, with special attention given to the Kingston area for which higher resolution data bases have been developed. The general issue of inferring high resolution-quality conclusions from low resolution runs is addressed.
Appendix
A: Statistical Estimation Methodology
B: Output Data Set Description
C: Chronology of the Research
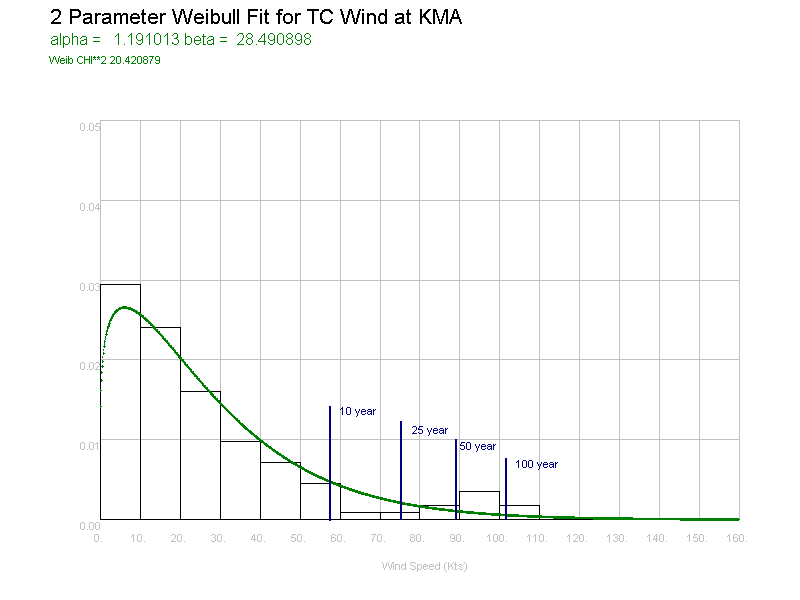
Return periods provide a conceptual basis for quantifying the uncertainties associated with wind, wave and storm surge due to tropical cyclones. Return period is technically defined (Simiu and Scanlan, 1996, p. 603) as the reciprocal of the annual probability of observing a specific hurricane effect (or more extreme effect). Suppose the probability distribution corresponding to the annual extreme wind at a given site were known (for example, the smooth curve in Figure 1). The ninetieth percentile of this distribution reflects the 10 year return period wind, since there is a one in ten chance of observing such a wind (or greater) in a given year. Similarly, the ninety-sixth percentile gives the 25 year return period wind; the ninety-eighth percentile gives the 50 year return period wind and the ninety-ninth percentile gives the 100 year return period wind. The key to determining return periods is to determine the probability distribution of annual extremes. If the distribution were "known," then there would be no uncertainty associated with the return period values. Of course, these distributions are not known and must be estimated from available data and modeling efforts.
Figure 1. Relationship of Return Period to Annual Probability Distribution of Extreme Wind (1 minute sustained at 10m, in knots).
The approach applied here for estimation of the annual probability distribution of extremes has been reported by Johnson and Watson (1998) and is given in abbreviated form in Appendix A. The historical Atlantic tropical cyclone storm set HURDAT (Neumann, Jarvinen, McAdie and Elms, 1993 with updates through 1997) provides a set of 959 storms for the period 1886-1997. For each storm, TAOS/R (Watson, 1995) simulates the hurricane using the current topography, land use/land cover and bathymetry and collects the maximum wind, wave and storm surge height over the duration of the storm at each study site location (i.e., for each grid cell). The annual maximum of each peril is recorded and provides the basic "data" used in the statistical fitting procedure outlined in Appendix A. The Weibull distribution is used as the probability distribution of choice for each peril, with the distributions estimated separately for each location. From the fitted Weibull distributions, both maximum likelihood estimates (best estimates) and attendant prediction limits (plausible upper limits) are determined. Specific examples of the use and interpretation of these calculations are given in the next section.
Previous approaches to determining return period phenomena in the Caribbean have been rather subjective, focusing on the most severe event or events recorded this century followed by some intelligent perturbations of these storms to identify 25-, 50-, and 100- year basic events. The extent of selection and modification of the events could lead to debate that is driven by the results of the analysis rather than by the intrinsic scientific merit of the approach. Another classical approach involves selecting all storms within a given distance of a site and then performing an analysis presuming that the storms were direct hits (Chu and Wang, 1998). By using the complete set of storms in this study, issues with an arbitrary distance cutoff are circumvented.
The purpose of this report is to present the results of the return period estimation methodology as it pertains to the Caribbean, especially the Kingston area of Jamaica. These results are intended to address the question, "What sort of extreme hurricane phenomena should be expected at a given site in the next n years?" Values of n of interest here are 10, 25, 50 and 100 years. Complete statistical details can be found in Johnson and Watson (1998), beyond those available in Appendix A. An earlier version of the methodology can be found in Johnson (1997).
Section 2 introduces the return period estimation calculations and interpretations, using the center of the port of Kingston as illustration. Section 3 expands consideration to the entire Caribbean at low resolution (1 arc minute and 30 arc seconds). An electronic data base of return periods (maximum likelihood estimates and 90% prediction limits) for wind, wave and storm surge is described. Section 4 addresses the issue of extrapolating low resolution results to higher resolution grids, using multiple resolution results obtained in Jamaica and Florida. Situations are characterized where the low resolution results may suffice and indicate other possibilities where high resolution results could be different and quantify the discrepancies. Finally, in Section 5 the key findings for the Organization of American States (OAS) are reviewed and a discussion of potential future efforts are described.
To illustrate return period concepts applied to a specific example, consider a central location in the port of Kingston, Jamaica (specifically at 76.676W, 17.976N). All storms in the full set of 959 storms were simulated using TAOS/R and the extreme effects of wind, wave and storm surge were recorded at each site for the storms’ duration. TAOS/R is a meteorological hazard model having an object oriented design with state of the art modules for wind, wave and storm surge components of the model (Watson, 1995; Watson and Johnson, 1998). TAOS/R integrates a geographic information system technology allowing the seamless input and output of calculated results for graphical display. The statistical analysis (TAOS/SAP) proceeds using the annual maxima (112 values) for each peril. Focussing on wind for the Kingston port, the Weibull fit gave the estimate (1.191013, 28.490898) for the parameters (a , b). This fit was given previously in Figure 1 in Section 1. For many applications (structural design, land use planning and emergency management), the associated return periods are of primary interest, while the Weibull fits provide assurance that the methodology is in order. The results for the central port (units in knots) are, as follows:
MLE |
50% |
75% |
90% |
95% |
99% |
|
| 10 year | 57 |
58.2 |
61.2 |
63.9 |
66.0 |
70.4 |
| 25 year | 76 |
77.0 |
81.6 |
86.7 |
90.6 |
104.4 |
| 50 year | 89 |
90.5 |
97.0 |
105.0 |
111.4 |
130.4 |
| 100 year | 102 |
103.1 |
112.8 |
124.0 |
133.1 |
157.8 |
Table 1. Kingston Central Port Wind Results (knots): Maximum Likelihood Estimates and Upper Prediction Limits for Various Return Periods (1 minute sustained wind at 10 meters above ground).
The MLE (maximum likelihood estimate) column provides the best estimate as to the mostly likely extreme one minute-ten meter sustained wind for the various time frames. The MLEs are approximately equal to the "median" or 50% values (in knots). This implies that roughly speaking, the MLE is too low about half the time and is too high the other half of the time. From a planning standpoint, one might wish to "hedge one’s bets" to protect against worse than expected phenomena. The 75%, 90%, 95% and 99% columns are useful for this purpose. For example, 66.0 knots is given for the 95% upper prediction limit for the 10 year return period. Although the best guess of extreme wind in the next ten years is 57 knots, there is only a 1 in 20 chance (corresponding to the 95% level) that the extreme wind will exceed 66 knots. The difference between the 57 and 66 knot wind values reflect the inherent uncertainty in predicting return period values.
Continuing the example, the 112 storm surge annual maxima led to a Weibull fit having estimates (0.983402, 1.172233) for (a , b ) and return period estimates (in meters) given in the following table:
MLE |
50% |
75% |
90% |
95% |
99% |
|
| 10 year | 2.737 |
2.758 |
2.958 |
3.122 |
3.193 |
3.397 |
| 25 year | 3.848 |
3.897 |
4.193 |
4.519 |
4.791 |
5.505 |
| 50 year | 4.693 |
4.714 |
5.157 |
5.636 |
5.932 |
7.112 |
| 100 year | 5.539 |
5.586 |
6.136 |
6.941 |
7.542 |
8.777 |
Table 2. Kingston Central Port Storm Surge Results (meters): Maximum Likelihood Estimates and Upper Prediction Limits for Various Return Periods.
Again, MLE results and the "upper" 50% prediction limits are quite close to each other, indicating the MLE value is in the center or middle of the distribution of future extremes. Using the above table as a guide, a structural design engineer could propose that an asset located at this site ought to be built to survive a 5.636 meter storm surge for a 50 year return period to achieve a 90% prediction limit level. Building to survive a 4.693 meter storm surge has about a 50-50 chance of being inadequate.
Finally, for the untransformed deep water significant wave height (in meters), the Weibull fit gave estimates (1.434532, 3.960167) for (a , b ) and the return periods given in the following table:
MLE |
50% |
75% |
90% |
95% |
99% |
|
| 10 year | 7.1 |
7.2 |
7.5 |
7.8 |
8.1 |
8.9 |
| 25 year | 8.9 |
9.1 |
9.6 |
10.3 |
11.1 |
14.8 |
| 50 year | 10.2 |
10.3 |
11.0 |
11.9 |
13.1 |
18.0 |
| 100 year | 11.5 |
11.6 |
12.6 |
14.0 |
16.0 |
22.3 |
Table 3. Kingston Central Port Wave Height Results (untransformed deep water significant wave height in meters): Maximum Likelihood Estimates and Upper Prediction Limits for Various Return Periods.
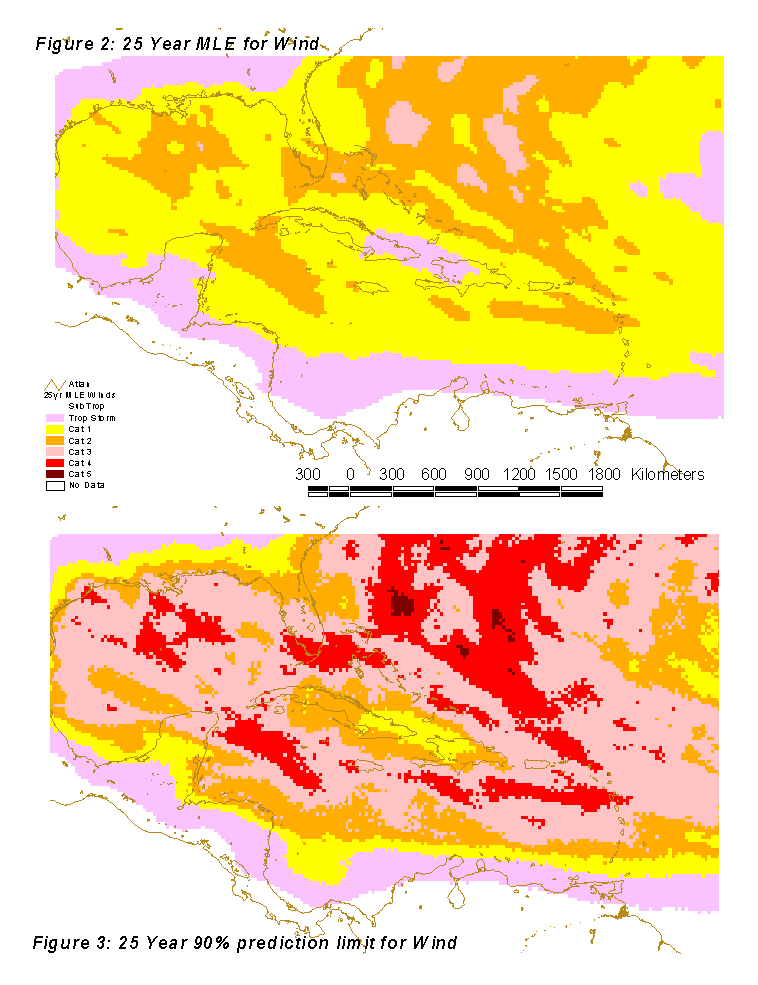
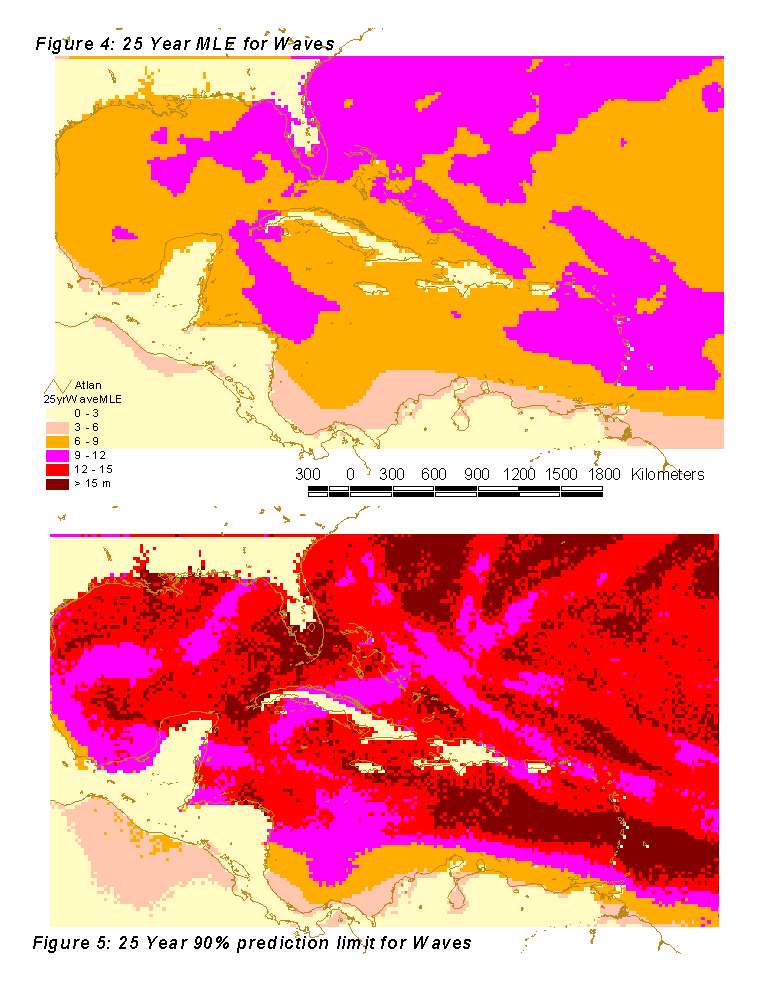
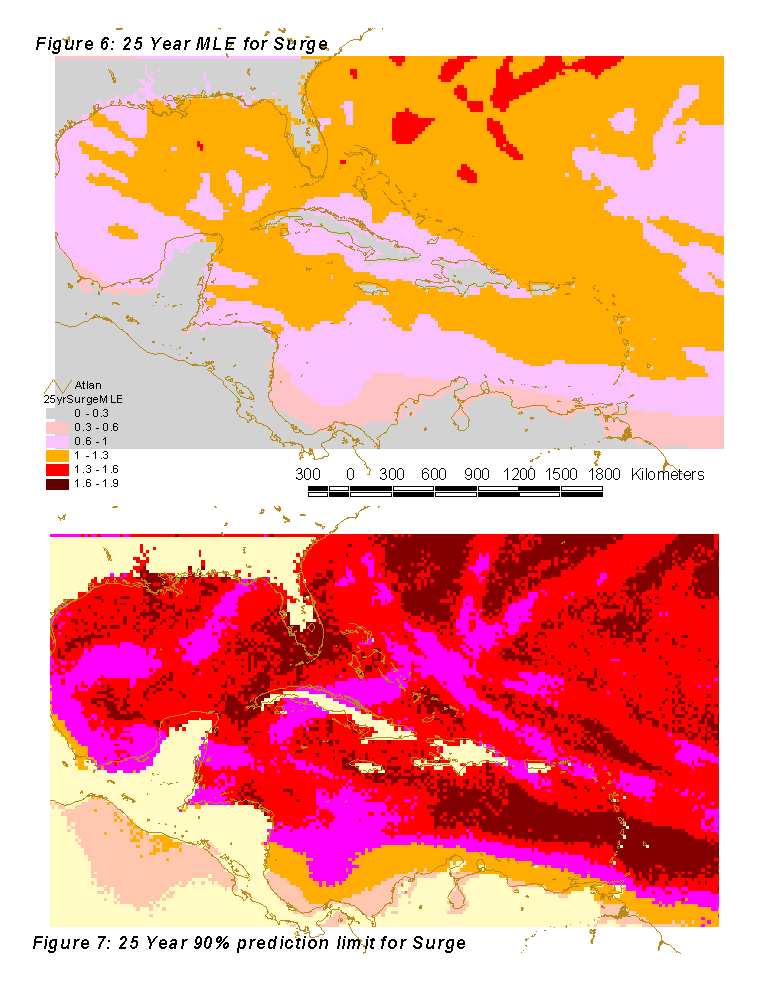
The TAOS/SAP storm hazard model and statistical analysis package with the TAOS 30-arcsecond Caribbean land cover and elevation data base was used to obtain maximum likelihood and upper 90% prediction limits for wind speeds, wave height and storm surge for each cell in the regional data base. As indicated in Section 2, all 959 tropical cyclones were simulated on the current topography-bathymetry and the statistical methodology applied to annual maxima at each cell. The results are available as Mapinfo Interchange Files. Details are available in Appendix B.
As illustration, Figures 2-7 show the maximum likelihood and upper 90% prediction limits for 25 year return period wind speeds, wave heights and storm surges. Of course, with the files, one can zoom into any smaller region of interest as well as altering the gradation levels. The effective resolution for the figures is 2 arc minutes but the underlying calculations are at 30 arc second resolution. Likewise, one can switch to 10-, 50- or 100-year return periods using the appropriate files described in Appendix B.
Even at low resolution, it is apparent that the maps produced have reasonable transitions and conform to known hazards. It is also possible to see the effects of high elevations of Hispaniola, which tends to protect the leeward (i.e., west to northwest side) side of the island (resulting in lower return period wind speeds). The protective nature of the mountains of Hispaniola was evident recently with Hurricane Georges (1998) in which landfalling winds of 110 mph were followed by exiting 75 mph winds. Typical intensification for northwest tracking storms toward the Yucatan Straits is apparent. Also, there is a strong north-south gradient for the southern Caribbean (10 to 15 degrees N. latitude). Besides passing these (and other) common-sense or reality checks, the maps quantify the hurricane perils in an unbiased fashion – there is no built in cushion to the numbers so as to err on the conservative side. Furthermore, the underlying data bases are self-contained – there are no "calibration runs" made to estimate artificial parameters with the intent to enhance a match between observed and modeled phenomena.
Although the focus of the discussion has been on wind return periods, it is apparent that similar remarks can be made for wave height and storm surge. Of course, since wind is the driver for the other two phenomena it is comforting to observe basic consistencies. The files described in Appendix B can be used to zoom into other regions of interest at a 30 arc second resolution.
4. Low- versus High-Resolution Data: Florida and Kingston Case StudiesIn this paper, resolution refers to the smallest grid cell used in the the numerical calculations. In general, "high" resolution is to be preferred to "low" resolution as the former is more likely to incorporate terrain features appropriately provided the underlying data structures are in place. To paraphrase Watson and Johnson (1998), data acquisition, integration and quality control are a major, if not the major element of the modeling process. The purpose of this section is to delineate the effects of differing resolutions on hurricane hazard perils, especially storm surge, with case studies using Kingston and Florida.
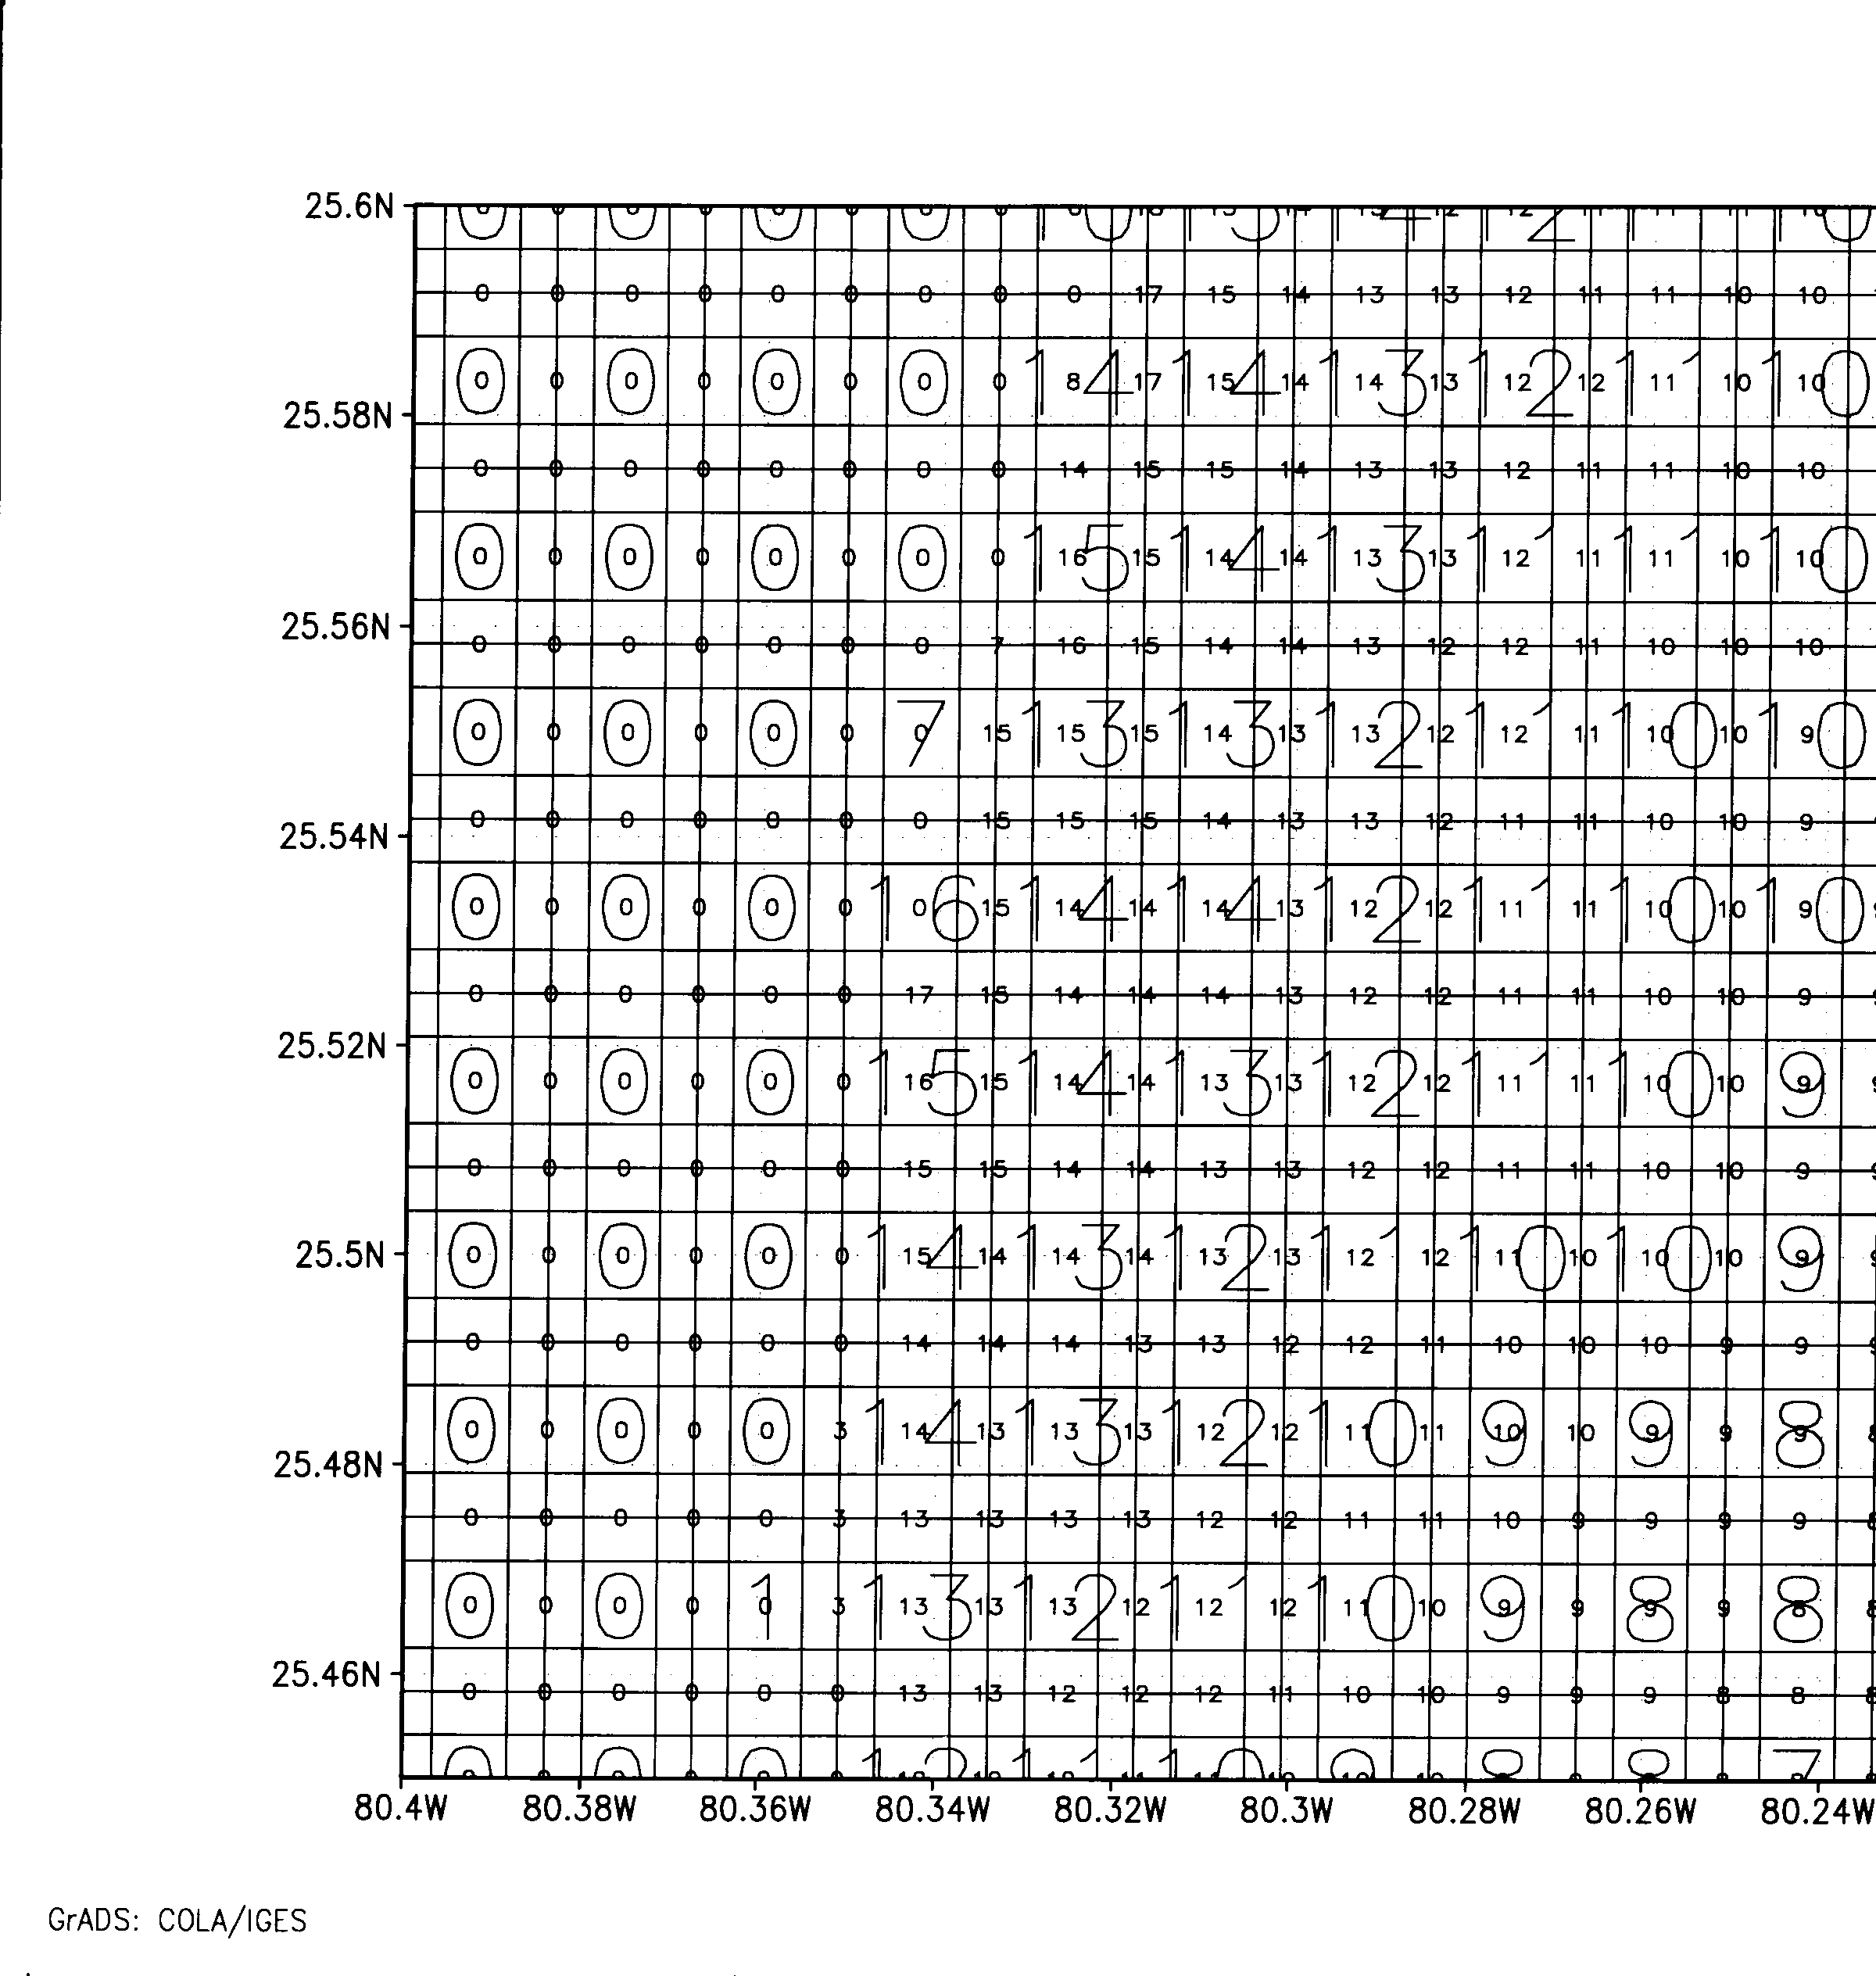
Florida. Consider an area of Biscayne Bay in the Miami area that was run at both one minute and thirty arc-seconds resolution to produce 100-year maximum likelihood storm surges. In this case the high resolution data have exactly double the resolution of the low resolution data. Consequently, the geometry of the two data sets overlay neatly so that a centroid at low resolution is also a centroid of one cell at high resolution. Figure 8 presents the results of storm surge rounded to the nearest foot with the larger font values corresponding to low resolution and the small font values corresponding to high resolution, with the numbers centrally located in their cells. For illustration, consider the location (80.34W, 25.55N). The high resolution values in this vicinity are:
| 0 | 0 | 7 |
| 0 | 0 | 15 |
| 0 | 0 | 15 |
Figure 8: Biscayne Bay Surge Results, Comparison of High and Low Resolution Grids
The low resolution value for the coincident central cell above is a 7, given in the larger font. Thus, the low resolution values are drawn from the whole coincident center cell, from "half" of the side cells (having values of 0 for west, 0 for north, 15 for east and 0 for south), and from "a quarter" of the corner cells (0 for northwest, 7 for northeast, 15 for southeast, and 0 for southwest). For low resolution, the value 7 is an output result that reflects the terrain representation, land cover and other features set at one minute resolution and is not really a simple mathematical average of the 9 cells or partial cells in this vicinity.
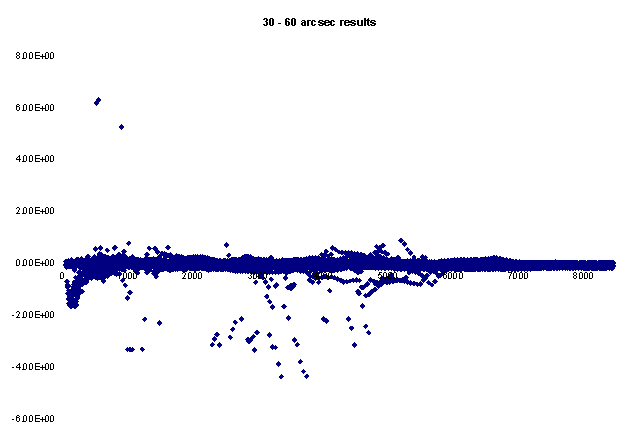
How best should the disparities between the low resolution and high resolution results be summarized? A direct numerical comparison over the entire study region could be quite deceptive, as there are many inland cells with no inundation. Likewise, cells that fall entirely over water tend to have very close agreement between low resolution cells and their high resolution counterparts. The "interesting" basis of comparison is along the shoreline or just inland where the deviations tend to be large and, thus, capture a severe case as well as the area of likely greatest damage. The boundary of inland inundation perhaps has the largest disparities in storm surge values for low versus high resolution, but this difference is obviously attributable to resolution, and takes place where the damage is likely less than at the shoreline. Focussing just on these cells represents a gross overestimate of the differences between the low and high resolution results. Hence, "interesting" cells are defined as those for which the elevation is -5 meters or shallower (eliminating deep water) and for which at least two of the 30 arcsecond cells (subsets of the larger 60 arcsecond cell) have positive inundation. This defining criteria produces a band of cells along the shoreline, which is the area of interest. For the 30 arcsecond versus 60 arcsecond comparison, TAOS/R was run at each of the two resolutions and then extracted the 8404 cells meeting the "interesting cell" criteria for the whole U.S. Figure 9 plots the 30 arcsecond storm surge minus the corresponding 60 arcsecond values (in meters) for the Atlantic coast of the United States from Brownsville (position 1 along the x-axis) to the US-Canadian border (position 8404 along the x-axis). The results are quite striking. Foremost is that the difference in results for the two resolutions is generally quite small. In particular, 90% are within 0.208 meters while 95% are within 0.313 meters (about 1 foot). The are a goodly number of negative values near Brownsville corresponding to the barrier islands. Another pattern of negative values can be seen between cell numbers 4000 –5500 corresponding to the North Carolina coast. The scattered negative values correspond to pure resolution differences with the 60 arc second values failing to capture the structure impacting storm surge. There are three values greater than +5 meters along the Texas coast. Here these positive discrepancies occur due to anomalous coastal terrain where the low resolution cell has a high elevation overall with only a small portion of the cell inundated. This combined with the high water levels which can occur in this area produce these aberrant differences.
Figure 9. Comparison of Model Results for 30 and 60 arcsecond Grid Resolutions for US Coastline
The storm surge results in Figure 9 were produced in conjunction with the Florida project. Resolution impacts for wave height and wind were relatively minor compared to storm surge. Likewise, it would be natural to expect similar comparisons in the Caribbean. Storm surge resolution effects are site dependent and comparisons among resolutions ought to be performed along the shoreline, as were done in Figure 9. Over-water and inland non-inundation zones would unfairly favor the agreement between resolutions. For consistent shorelines, the agreement is quite good. For harbor or bay entrances close in size to the resolution of the run, effects can be somewhat site-specific.
The effects of resolution on wave height depend on the extent of induced refraction, defraction and reflection. As the resolution approaches the wave length of the incoming waves (approximately 40m), these effects are reproduced by the physical model. For resolutions larger than the wave length, the effects are handled parametrically. This is not an issue for the Caribbean project since the resolution ranges from 6 to 30 arc seconds (180 to 980 m).
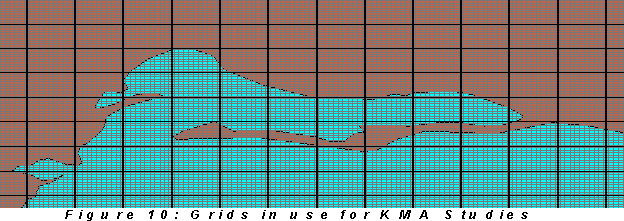
Kingston. An important impetus for this report was to provide the Kingston area with the level of analysis performed at Montego Bay (Johnson, 1997) in terms of resolution and to provide the Caribbean with spatial coverage at 30 arc second resolution. An interesting facet of the Kingston area analysis is that the multiple resolution data bases (30 and 6 arc seconds) do not share common cell centroids (unlike with the Florida data bases). Figure 10 indicates the geometry of the two resolutions. The lack of common centroids complicates the analysis but can be circumvented to some extent for storm surge by considering the shoreline profile as has been presented earlier. In conjunction with a shoreline map of bays and harbor entrances, the potential impacts of using low resolution data can be anticipated relative to existing physical structures. The shoreline profile also draws attention to regions that are likely to experience the heaviest damage from storm surge. For the harbor entrance, it appears that for a low resolution analysis, the cell configuration provides a "depth" of the channel that is artificially high, which is tantamount in the model to blocking the exit of excessive water that has entered the harbor by overflowing the Palisadoes. Hence, low resolution values of storm surge could be higher than for high resolution values of storm surge in the vicinity of the harbor entrance.
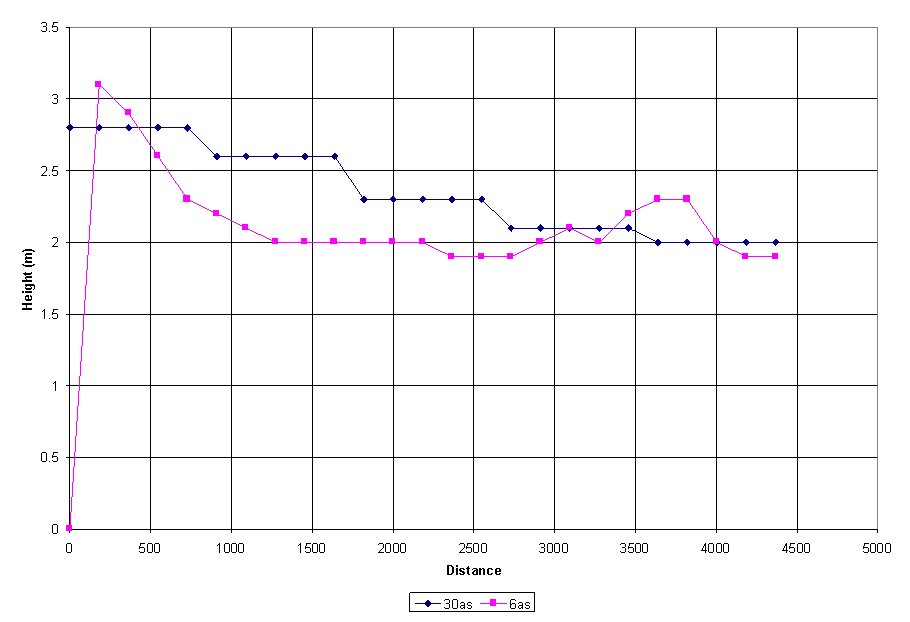
Figure 11 provides differences in MLE 25-year storm surges for a transect across the harbor entrance. The effect of the twenty-five fold increase in resolution are apparent. Recall that Figure 10 gives an indication of the shoreline and the geometry of the two resolutions. The higher resolution provides a greater capability to model the exiting flow of water from the east bay toward the harbor entrance. In addition, the steep incline on the mainland is captured more accurately, resulting in the higher water level at the shore near the 200m mark. The low resolution provides artificially shallow water depths in the shipping channel and elsewhere in the harbor, which inhibits the escape of water overflowing the Palisadoes and channeling out the harbor entrance. An average near shore depth of 5 meters versus 10 meters translates to an overall one meter increase in storm surge. These comments apply as well for 10-, 50-, and 100-year return period storm surge values.
Figure 11. Difference in storm surge model results using low- and high-resolution grids for Kingston area, (30 and 15 arc-second resolutions)
In general, it must be emphasized that the physical modeling results can be only as good as the quality of the underlying data bases on land cover and DEM (both topography and bathymetry). For Kingston, the available data sources do not support a resolution better than approximately 6-10 arc seconds. The highest resolution modeling for this report was made at a resolution of 6 arc seconds (182 meters), while a resolution of 1 arc second (30 meters) was used for the Florida project.
5. Conclusions and Future EffortsReturn period estimation methodology affords the Organization of American States the opportunity to characterize the probabilities of hurricane perils throughout the Caribbean. Even for low resolution (30 arc-seconds), considerable information is made available that has the possibility of being extrapolated to higher resolution, as outlined in Section 4. In fact, for many applications, low resolution is more than adequate for wind speed return periods. Storm surge and wave height are more sensitive to resolution than wind speed, but except for some special structures (bays and harbor entrances, for example), the agreement between low and high resolution is reasonable. In general, the results are quality-limited by the underlying DEM (both topography and bathymetry).
Future studies for the Caribbean could be run at higher resolution provided the associated DEMs and other pertinent data bases were developed appropriately. Using LANDSAT data and sophisticated processing, a resolution of 1 arc second could be attainable. Hazard analyses associated with riverine flooding could also be conducted by drawing upon this methodology. Clearly, hurricane Mitch (1998) demonstrated the severe impacts of massive rainfall associated with a down-graded storm.
6. ReferencesChu, P.-S. and Wang, J. (1998), "Modeling Return Periods of Tropical Cyclone Intensities in the Vicinity of Hawaii," Journal of Applied Meteorology, 37, 951-960.
Johnson, M. E. (1987), Multivariate Statistical Simulation. New York: Wiley.
Johnson, M. E. (1997), "Caribbean Storm Surge Return Periods," Organization of American States Caribbean Disaster Mitigation Project Workshop, Kingston, Jamaica, October 31, 1997.
Johnson, M. E. and Watson, C. C., Jr. (1998), "Return Period Estimation of Hurricane Phenomena," submitted.
Law, A. M. and Kelton, W. D. (1991), Simulation Modeling and Analysis. New York: McGraw-Hill, Inc.
Neumann, C. J., Jarvinen, B. R., McAdie, C. J., and Elms, J. D. (1993), Tropical Cyclones of the Atlantic Ocean, 1871-1992, Asheville: National Climatic Center Data Center.
Simiu, E. and Scanlan, R. H. (1996), Wind Effects on Structures. New York: Wiley.
Watson, C. C., Jr. (1995), "The Arbiter of Storms: A High Resolution, GIS-based System for Integrated Storm Hazard Modeling," National Weather Digest, 20, 2-9.
Watson, C. C., Jr. (1997), "TAOS Model for the Caribbean," Organization of American States Caribbean Disaster Mitigation Project Workshop, Kingston, Jamaica, October 31, 1997.
Watson, C. C., Jr. and Johnson, M. E. (1998), "A Modular, Object Oriented Model for Meteorological Hazard Assessment," submitted.
Appendix A. Statistical Estimation MethodologyThe method used at an individual site for a single phenomena (wind, wave or storm surge) is applied at every site in a study region. Hence, it suffices to explain the methodology for the generic situation in which there are 112 years (1886-1997) of annual maxima of one of the effects of wind, wave or storm surge at a site, say x1, x2, …, x112. The steps are given, as follows:
n/b - n ln b S ln xi - S (xi /b )a ln (xi /b ) = 0, where
b = [( S xia ) / n] 1/a .
¶ 2 ln L / ¶ a ¶ a = - n/a 2 - S (xi /b )a [ln (xi /b )]2
¶ 2 ln L / ¶ a ¶ b = - n/b + (a /b ) S (xi /b )a ln (xi /b ) + (1/b ) S (xi /b )a
¶ 2 ln L / ¶ b ¶ b = (na /b 2) { 1 - [(a +1)/(nb a )] S xia }
where ln L is the logarithm of the likelihood function and all summations proceed from i equal one to n (n equals 112 if the full HURDAT data set is being used).
s 1 = Ö
D11
s 2 = Ö D22
r = D12 / (Ö D11Ö D22 )
where Dij is the (i, j)th element of the matrix D.
a) Generate independent normal variates X and Y and a uniform variate U.
b) Compute
V = s 1 X + a
W = s 1 [r X + Ö (1-r 2) Y] + b
R = W [- ln (1 – U1/n )] 1/V,
where a and b are the MLEs. Repeat this simulation process a large number, say N times (1000 should suffice for up to 99% prediction limits), storing the generated R values. Sort them in ascending order and the (0.90 x N)th item is the simulated 90% prediction limit.
TAOS/SAP implements the statistical analysis steps given above. A conservative (dense) grid is used to solve the MLE equation for a in step 1 so as to avoid convergence problems (especially for the Florida project). The asymptotic variances and covariances are direct, closed-form evaluations rather than being extracted from a final Newton-Raphson solution step. Further discussion of multivariate simulation can be found in Johnson (1987), while general simulation topics are covered by Law and Kelton (1991). A more extensive discussion of the statistical underpinnings of the procedure outlined above is given by Johnson and Watson (1998).
The data sets are produced as Mapinfo Interchange Files (MIF). These files are ASCII text files, and are easily imported into a variety of Geographic Information Sys tems (GIS). Data sets are provided for 10, 25, 50, and 100 year return periods for the Kingston Metropolitan Area at a resolution of 6 arc seconds (182m) per cell, and across the entire Caribbean basin at 30 arc seconds (982m). The files given below are available electronically from OAS.
File Name Convention: Each data set consists of two files: LLLyyyyr.mif and LLLyyyyr.mid, where
| LLL | Location Code: car is the Caribbean 30 arc second data sets; kma is the Kingston Metropolitan Area 6 arc second data sets |
| yyy | The return period in years |
Example: kma025yr.(mif,mid) are the files containing the Kingson 6 arc second data.
File Data Description: Each data set consists of a coordinate file(.mif) and a data file (.mid). The MIF format is documented in the MapInfo Professional Reference Guide, available from the MapInfo Corporation. These files are version 3.0 format files. Most GIS software can import MIF files. The MID file consists of 22 data fields.
The data for each phenomenon is presented as PP_TTT
where PP is
| ST | storm surge |
| WS | wind speed |
| WH | wave height |
and where TTT is
| EMP | empirical value (the 1-1/(return period) percentile value of the sorted yearly results) |
| MLE | value of the maximum likelihood estimate |
| P50 | 50% prediction limit value |
| P75 | 75% prediction limit value |
| P90 | 90% prediction limit value |
| P95 | 95% prediction limit value |
| P100 | 99% prediction limit value |
For example, the field ST_P75 in the file car050yr.mif is the 50 year return period 75% upper prediction limit value for storm surge, Caribbean 30as data set .
The surge file has one additional field, DEM, which is the height of the DEM at the cell centroid.
The purpose of this appendix is to describe the evolution of research among several inter-related projects having distinct output products but some commonality of methodologies. This appendix may also facilitate further refinements by future researchers.
Watson Technical Consulting, Inc. and OAS have had a long term collaboration, starting originally in 1993 with projects involving Belize, Jamaica and the Bahamas. Modeling efforts for the Caribbean Disaster Mitigation Project involved the use of various versions of the TAOS model throughout the Caribbean. A high resolution study for Montego Bay, Jamaica provoked interest in return period analyses with the recognition that several distinct methods (with vastly different results) were in use. On May 8, 1997, the authors of this report met in Rincon, Georgia with Steven Stichter of the Organization of American States to assess the "return period" problem. It was hypothesized that the annual maxima of phenomena could capture the information necessary to infer return periods. (The Simiu and Scanlan reference was not recognized for return periods at that time.) The May 8 meeting culminated in the recognition of the need to search for an appropriate probability distribution for annual extrema obtained from TAOS/R. The annual observed extreme winds at a given site are unlikely to be available (observations are sparse or missing—no anemometer survived a direct hit) and for storm surge values, the current topography and bathymetry may be substantially different than from previous years. Historical data are not ignored—rather they are used to validate the TAOS/R model (Watson, 1997) that simulates all 959 storms in the 112 year (1886-1997) storm set.
Although it may be true that "a problem well-posed is half-solved," there remained some work in the details. Moreover, the initial OAS project was restricted to storm surge at Doctor’s Point, Montego Bay, Jamaica for illustration. The Weibull distribution was successfully demonstrated to be feasible (and was superior to more than a dozen other competing distributions) to model annual maxima storm surge to infer return period values and associated confidence limits. Several additional issues remained following the presentation of the methodology at a workshop in Kingston, Jamaica on October 31, 1997. In particular,
Although there was strong interest after the Kingston workshop for expanding the pilot study to the full Caribbean, a decision was made to delay its initiation until results of a related effort for the state of Florida were better known. The Florida project, which commenced in January of 1998 (awarded in part due to the accomplishments with OAS), included provisions for determining return period estimates for wind, wave and storm surge at high resolution (one arc-second or about 30 meters). Since 1 arc second resolution implies over one billion sites in Florida, extensive automation has been required, making use of satellite imagery, various DEM and bathymetry sources and the development of a self-contained statistical analysis distribution fitting component. In particular, the Expert Fit distribution fitting package (Law and Kelton, 1991), essential for the Montego Bay study, became impractical with this many sites. In the Florida project, the Weibull, lognormal and inverse Gaussian distributions were considered in detail and it was concluded that the Weibull distribution is to be preferred. This preference is not solely for Florida but for the full Atlantic basin (including, of course, the Caribbean). Additional commercially-funded investigations in the southern Caribbean further substantiated the regional approach. Hence, as had been anticipated by OAS, the Florida project has indeed been leveraged to produce methodology that could be transferred to the Caribbean domain. The current OAS project covers the entire Caribbean at low resolution (30 arc seconds) and the Kingston area at 6 arc second resolution.