PGDM Inland Flood Hazard Map: Barbuda
A higher resolution map image
is also available (JPG 600k)
Map Text
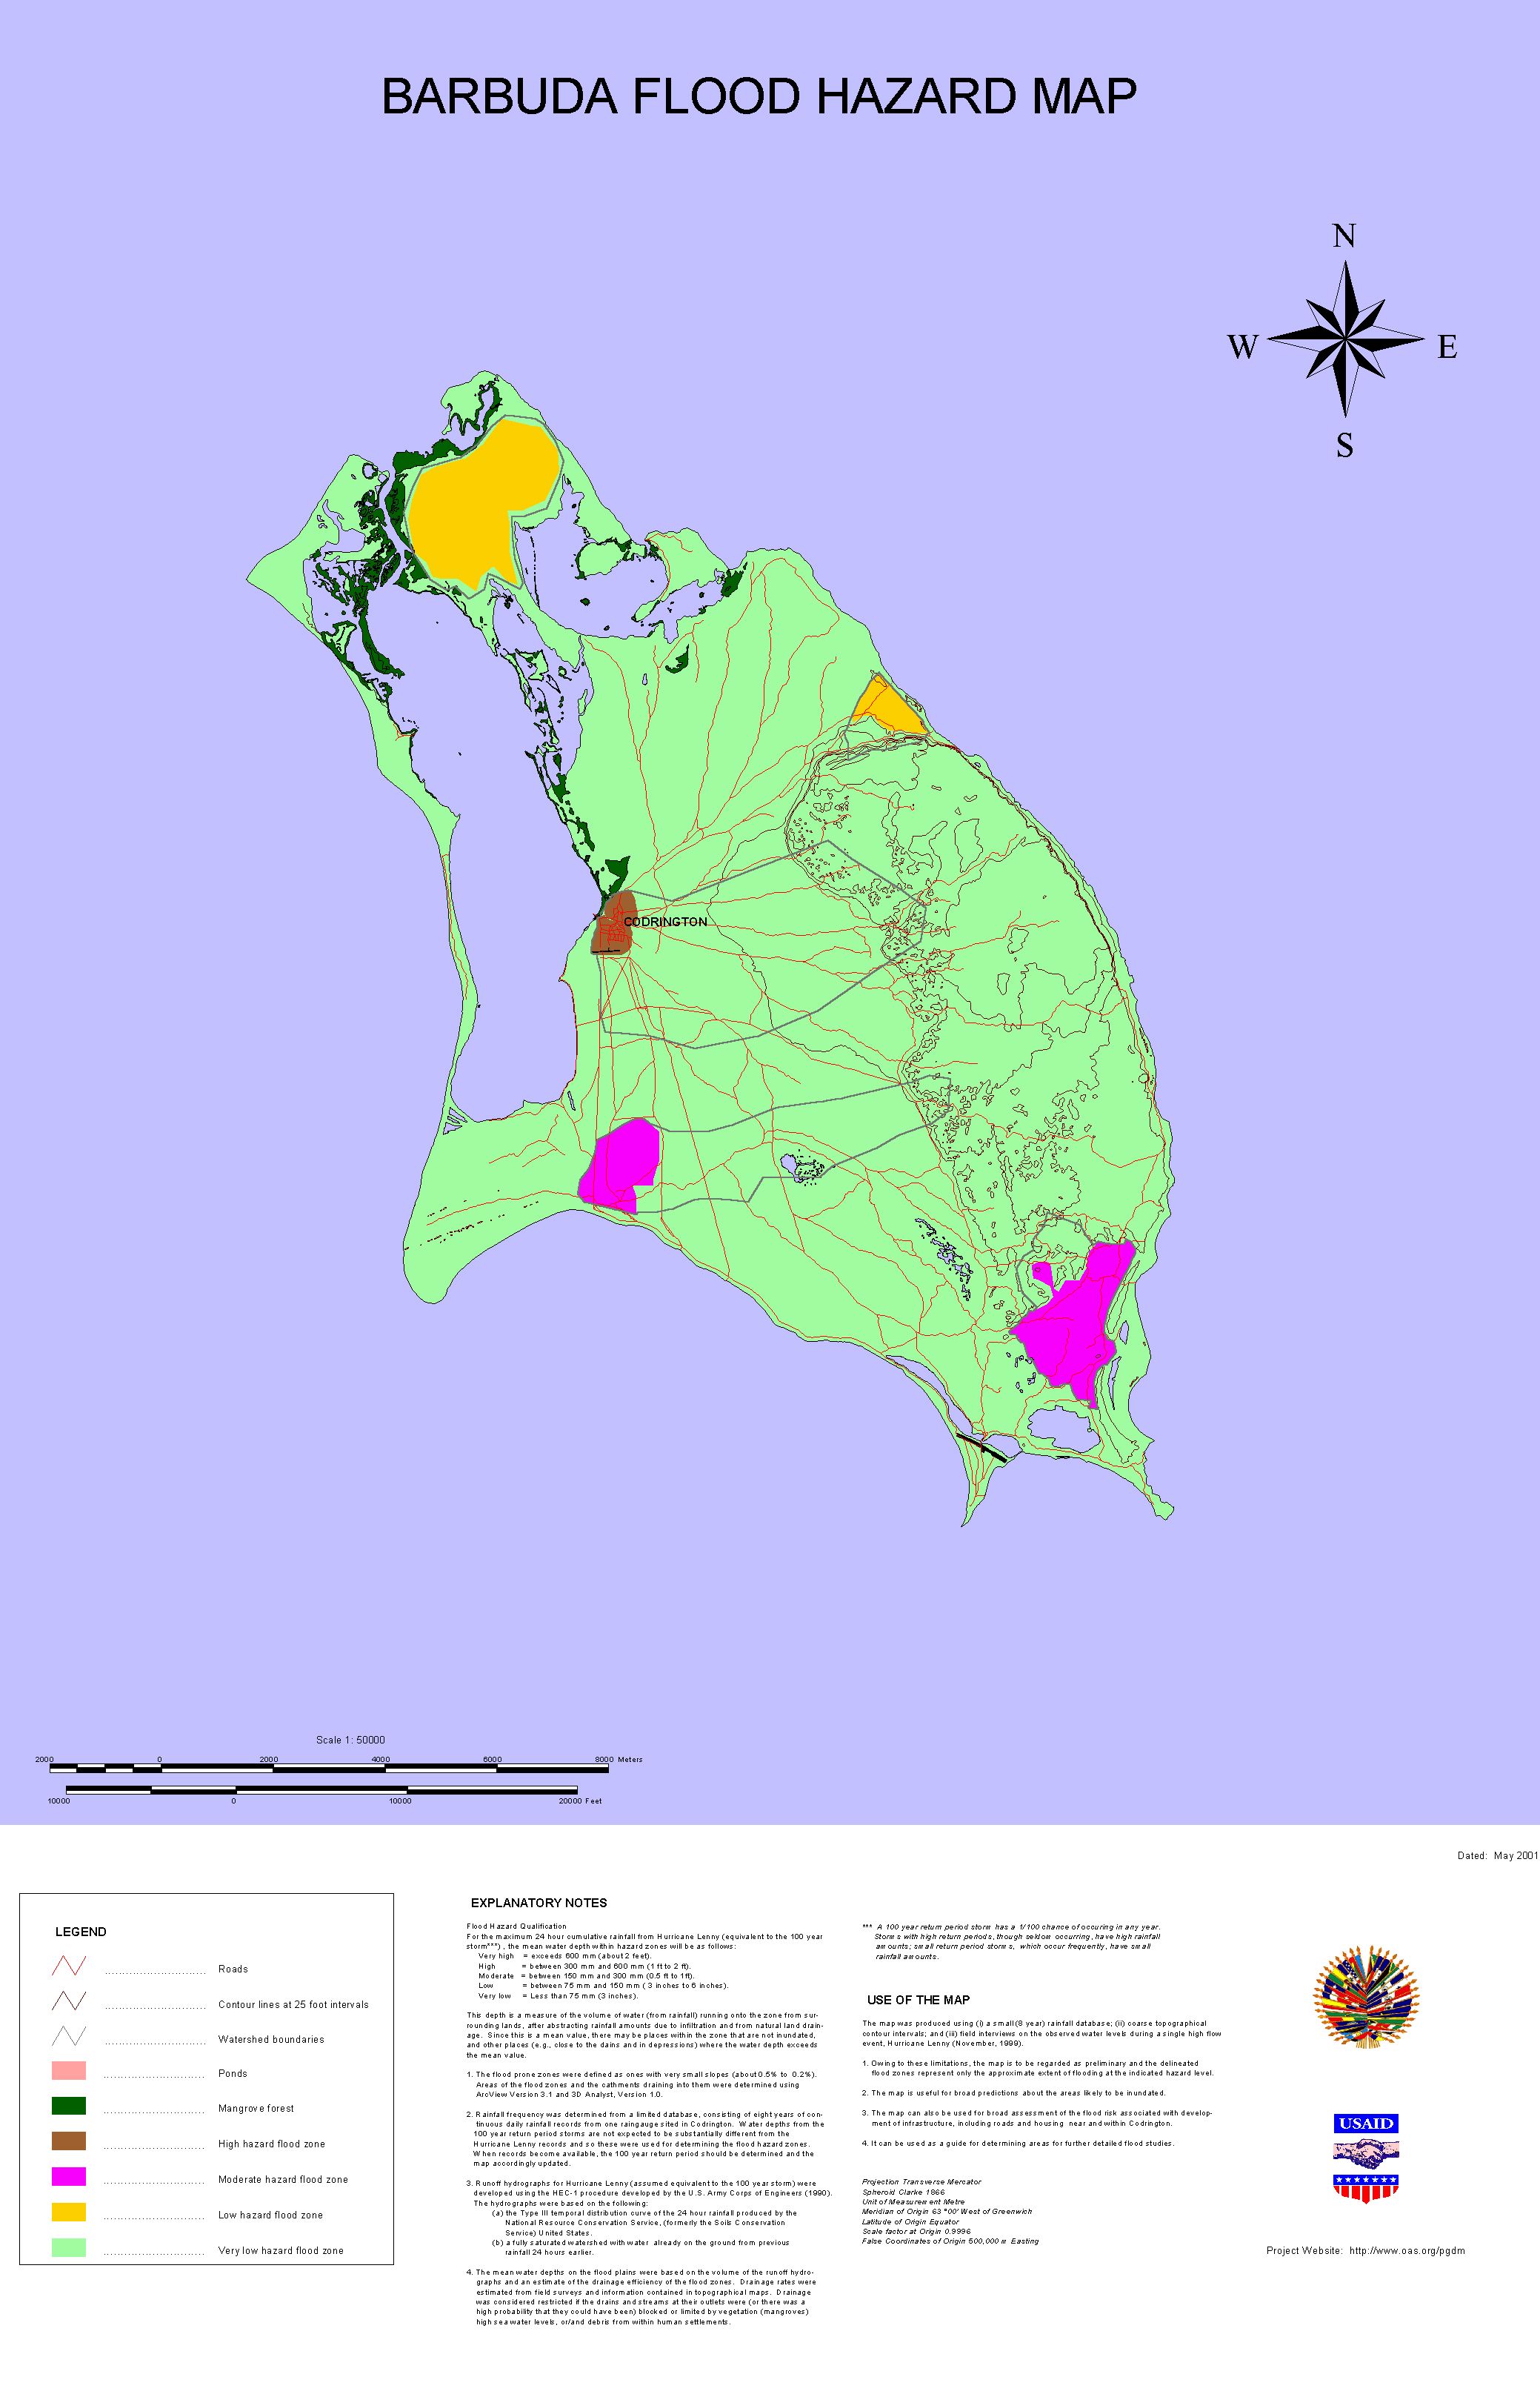
EXPLANATORY NOTES
Flood Hazard Qualification
For the maximum 24 hour cumulative rainfall from Hurricane
Lenny (equivalent to the 100 year storm***), the mean water depth within hazard
zones will be as follows:
-
Very high = exceeds 600 mm (about 2 feet).
-
High = between 300 mm and 600 mm (1 ft to 2 ft).
-
Moderate = between 150 mm and 300 mm (0.5 ft to 1ft).
-
Low = between 75 mm and 150 mm ( 3 inches to 6 inches).
-
Very low = Less than 75 mm (3 inches).
This depth is a measure of the volume of water (from
rainfall) running onto the zone from surrounding lands, after abstracting
rainfall amounts due to infiltration and from natural land drainage. Since this
is a mean value, there may be places within the zone that are not inundated, and
other places (e.g., close to the drains and in depressions) where the water
depth exceeds the mean value.
- The flood prone zones were defined as ones with very small slopes (about
0.5% to 0.2%). Areas of the flood zones and the catchments draining into
them were determined using ArcView Version 3.1 and 3D Analyst, Version 1.0.
- Rainfall frequency was determined from a limited database, consisting of
eight years of continuous daily rainfall records from one raingauge sited in
Codrington. Water depths from the 100 year return period storms are not
expected to be substantially different from the Hurricane Lenny records and
so these were used for determining the flood hazard zones. When records
become available, the 100 year return period should be determined and the
map accordingly updated.
- Runoff hydrographs for Hurricane Lenny (assumed equivalent to the 100 year
storm) were developed using the HEC-1 procedure developed by the U.S. Army
Corps of Engineers (1990).
- The hydrographs were based on the following:
- the Type III temporal distribution curve of the 24 hour rainfall
produced by the National Resource Conservation Service, (formerly the
Soils Conservation
- Service) United States.
- a fully saturated watershed with water already on the ground from
previous rainfall 24 hours earlier.
- The mean water depths on the flood plains were based on the volume of the
runoff hydrographs and an estimate of the drainage efficiency of the flood
zones. Drainage rates were estimated from field surveys and information
contained in topographical maps. Drainage was considered restricted if the
drains and streams at their outlets were (or there was a high probability
that they could have been) blocked or limited by vegetation (mangroves) high
sea water levels, or/and debris from within human settlements.
*** A 100 year return period storm has a 1/100 chance of
occurring in any year. Storms with high return periods, though seldom
occurring, have high rainfall amounts; small return period storms, which occur
frequently, have small rainfall amounts.
USE OF THE MAP
The map was produced using (i) a small (8 year) rainfall
database; (ii) coarse topographical contour intervals; and (iii) field
interviews on the observed water levels during a single high flow event,
Hurricane Lenny (November, 1999).
- Owing to these limitations, the map is to be regarded as preliminary and
the delineated flood zones represent only the approximate extent of flooding
at the indicated hazard level.
- The map is useful for broad predictions about the areas likely to be
inundated.
- The map can also be used for broad assessment of the flood risk associated
with development of infrastructure, including roads and housing near and
within Codrington.
- It can be used as a guide for determining areas for further detailed flood
studies.
Mapping Information
Projection Transverse Mercator
Spheroid Clarke 1866
Unit of Measurement Metre
Meridian of Origin 63 °00' West of Greenwich
Latitude of Origin Equator
Scale factor at Origin 0.9996
False Coordinates of Origin 500,000 m Easting