![]()
![]()
![]()
![]()
![]()
1. Geographic information systems
2. Remote sensing in natural hazard assessments
3. Special mapping techniques
![]()
An increasing number of planning agencies throughout the region are attempting to undertake natural hazard mitigation activities through development planning studies. However, while the expertise and baseline data in the form of maps, documents, and statistics may exist, a systematic approach is often lacking. The volume of information needed for natural hazards management, particularly in the context of integrated development planning, exceeds the capacity of manual methods and makes the use of computerized techniques compelling.
Geographic information systems (GIS) can play a crucial role in this process, serving as a tool to collect, organize, analyze and present data. A GIS is a systematic means of combining various bits of information about a unit of geographic space. The concept is analogous to a panel of post-office boxes, each representing a specified area. As each element of information about a particular attribute (soil, rainfall, population) that applies to the area is identified, it can be placed into the corresponding box. Since there is theoretically no limit to the amount of information that can be entered into each box, huge volumes of data can be compiled in an orderly manner, generating a collection of mapped information which reveals spatial relationships between the different attributes, e.g., hazardous events, natural resources, and socioeconomic phenomena, and can thus help planners assess the impact of natural events on existing and proposed development activities.
The use of GIS offers a number of advantages:
- It can be surprisingly cheap; very expensive equipment and highly specialized technicians can be avoided by proper selection of a system and its application. The main constraint is not typically a lack of funds but rather a lack of trained personnel.- It can multiply the productivity of a technician.
- It can give higher quality results than can be obtained manually, regardless of the costs involved. It can facilitate decision-making and improve coordination among agencies when efficiency is at a premium.
The information to be assembled in a GIS for hazards management will be determined by the level of application (national, regional, or local) and by what it is to be used for: natural hazard assessments, vulnerability assessments, disaster preparedness and response, or post-disaster relief and reconstruction activities. In general, there are three different categories of information:
- Natural hazards information, which denotes the presence and effect of natural phenomena. This information should ideally include the location, severity, frequency, and probability of occurrence of a hazardous event. Location is the easiest for planners to find; the rest can often be obtained from sectoral agencies, natural hazard research and monitoring centers, and, increasingly, integrated development planning studies.- Information on natural ecosystems (e.g., slopes and slope stability, river flow capacity, vegetation cover), which provides the basis for estimating the effect natural hazards can have on the goods and services these systems offer and also determines the factors or conditions that create, modify, accelerate, and/or retard the occurrence of a natural event.
- Information on population and infrastructure, which is the basis for quantifying the impact natural events can have on existing and planned development activities. Large-scale data describing lifeline infrastructure and human settlements, for example, are critical elements for preparing vulnerability assessments and for initiating disaster preparedness and response activities.
Most of these data are readily available throughout the region.
The GIS can be used for hazards management at different levels of development planning. At the national level, it can provide a general familiarity with the study area, giving planners a reference to the overall hazard situation. At the regional level, it can be used in hazard assessments for resource analysis and project identification. And at the local level, it can be used to formulate investment projects and specific mitigation strategies. The following section demonstrates its versatility.
Applications at the National Level
At the national level, planners can use GIS to categorize land with regard to natural hazards and determine whether, and to what extent, natural phenomena pose a significant danger. At this level, location is usually enough for a first estimation of the overall hazard situation. Examples of categories include:
- Hazard-free areas apt for development activities.- Areas prone to severe natural hazards where most development should be avoided.
- Hazardous areas where development has already taken place and measures to reduce vulnerability are needed.
- Areas where further hazard evaluations are required.
In hazard-prone areas, GIS can be used to overlay hazard information with socioeconomic or infrastructure data-on population density, location of urban areas, ports, airports, roads, electricity network-for a preliminary quantitative assessment of people and property at risk. This can provide the necessary elements for the identification of structural and/or non-structural mitigation measures, which can be incorporated as a component in integrated sectoral development projects or as part of a national strategy to lessen vulnerability.
The identification of existing critical facilities, infrastructure, and population in high-risk areas is also the first step in the vulnerability assessment for disaster preparedness and response.
Applications at the Regional Level
At the regional level, GIS can be used for a more detailed study to identify the development potential and hazard-related constraints of selected areas. Typically, national-level information is complemented at the regional level with more comprehensive mapped and tabular data including, for example:
- Hazard assessments, including use of remote sensing information (i.e., aerial photographs and satellite imagery).- Maps showing floodplain boundaries, landslide areas, seismic zones, tsunami-susceptible areas, etc.
- Soils, topography, land use, water resources, lifeline network, and density of population and structures.
With this type of information, it is possible to make a more intensive analysis relating natural hazards to planned or existing development activities. As with national-level exercises, the vulnerability of existing critical segments of production facilities, infrastructure, and human settlements can be determined, to give disaster mitigation and preparedness their proper priority in development activities.
Some examples of GIS applications at the regional level are:
- Identification of investment projects and preparation of project profiles showing where hazard mitigation measures (flood protections, earthquake resistant structures, etc.) must be taken into account in the design.- Preparation of hazard mitigation projects to reduce risk on currently occupied land.
- Guidance on land use and intensity.
These and other applications can take advantage of the flexibility of scale in a GIS: small to medium scale for resource inventory and project identification; medium scale for project profile and prefeasibility studies; and large scale for feasibility studies, hazard zone mapping, and urban hazard mitigation studies. Information originally entered for one purpose at a particular scale can be used for another at a different scale.
GIS capabilities can also be used at this level to generate hazard information not readily available. If applied to information about slope, precipitation, and the carrying capacity of rivers, for example, GIS could determine maximum flood levels and threshold levels of precipitation. Similarly, landslide inventories can be combined with data on slope, bedrock, and hydrology to provide the likelihood of a future landslide. Such syntheses can help planners determine where to construct a future dam or reservoir in order to prevent flood-induced damage, or where heavy capital investments or construction should be avoided and/or less landslide-susceptible activities implemented.
Applications at the Local Level
At the local level, planners can use a GIS to formulate projects at the prefeasibility and feasibility levels and to locate vulnerable lifeline network elements for the implementation of emergency preparedness and response activities. The presence of hazards should affect the site selection, engineering design, and economic feasibility of investment projects.
Lifeline networks are the critical elements of an area, which should be made as little vulnerable to damage as possible or be recognized as priority elements for rehabilitation or reconstruction following a disaster. In Latin America and the Caribbean, few planners will find already-prepared individual or aggregated lifeline network maps. Where none exists, a GIS can be used to prepare one. Some components typically included are:
- Ports and airports (primary and secondary, international, national, and regional, both public and private)- Hospitals, health centers, medical posts
- Police stations, fire stations
- Schools, universities, auditoriums, convention centers
- Energy infrastructure and supply system, including pipelines and transmission lines
- Road network (highways, primary and secondary roads, bridges, underpasses, railroads)
- Emergency management facilities
- Telecommunications transmission and relay installations
Once the lifeline network map has been prepared, it can be further combined with hazard information for an initial determination of the most vulnerable segments and the identification of mitigation measures and disaster preparedness activities.
Guidelines for GIS Acquisition
As enticing as it may look, a GIS is not always applicable to a given situation, and it may not necessarily pay for itself. Planners need to make a meticulous evaluation of their GIS needs in terms of specific objectives and applications before deciding to acquire a system. Among the basic questions that have to be answered are:
- What planning activities will be supported by the proposed GIS?- How many and what kinds of decisions is it intended to support?
- How will it improve planning activities and the decision-making process?
- How much information, time, and training are going to be needed to obtain the desired results? Is it feasible?
- How will the GIS be converted into local instructions? What difficulties can be anticipated among local administrators and decision-makers?
If this investigation reaches positive conclusions, the logical next step is to determine what kind of system should be acquired and the type of hardware and software to be used. In general, experience in the region shows that PC-based GIS are the most practical for planning teams analyzing natural hazard issues in integrated development projects. Although they may not produce maps of cartographic quality or of sufficient detail for engineering design they are capable of generating maps of varying scales and tabular information suitable for repeated analysis, project design, and decision-making, and are most affordable and relatively simple to operate.
Among PC-based GIS, however, there are still a myriad of possibilities among hardware and software combinations. Again, the system to choose should be simple and must, of course, fit the budget and technical constraints of the agency. Sophisticated (and expensive) systems require more technical skills, may be more difficult to maintain and repair locally, and, especially for the purposes of map analysis for hazards management, their added capabilities may not be worth the additional cost. Given the financial and technical constraints that prevail in the region, it is wise to start with a modest system and later expand it as the agency's needs dictate.
Remote sensing refers to the process of recording information from sensors mounted either on aircraft or on satellites. The technique is applicable to natural hazards management because nearly all geologic, hydrologic, and atmospheric phenomena are recurring events or processes that leave evidence of their previous occurrence. Revealing the location of previous occurrences and/or distinguishing the conditions under which they are likely to occur makes it possible to identify areas of potential exposure to natural hazards so that measures to reduce the social and economic impact of potential disasters can be introduced into the planning process.
Aerial remote sensing is useful to natural hazard management for focusing on priority areas, verifying small-scale data interpretations, and providing information about features that are too small for detection by satellite imagery. Among the available airborne systems, the most useful for natural hazard assessments and integrated development planning are aerial photography, airborne radars, and thermal infrared (IR) scanners. Each has its advantages and limitations:
- Aerial photography provides the closest approximation of what the human eye sees. The film can be black and white (the least expensive medium), conventional color, or color infrared. Its use is limited by the available light and the weather, but it shows considerably more detail than radar at the same scale.- Airborne radars are active sensors that produce their own illumination and whose images appear as black-and-white photography. They usually require an interpreter. Radar can be used at any time in any weather, and an area can be surveyed much more rapidly and distance can be measured more accurately with radar than with photography.
- Thermal IR scanners use a semiconductor detector sensitive to the thermal infrared part of the spectrum to produce imagery that defines the thermal pattern of the terrain. The capability of thermal imaging is unsurpassed, but because the airborne system can only be used at lower altitudes (under 3,000 m), it covers smaller areas than either radar or aerial photography. In addition, its recording technique produces inherent distortions in the final built-up image scene.
Despite their usefulness, extensive aerial surveys are not often undertaken since they commonly exceed the budget constraints of a planning study and may provide more information than necessary, particularly during the early stages.
Remote sensing from satellite vehicles has become increasingly important since the successful launch of Landsat 1 in 1972. It provides the synoptic view required by the broad scale of integrated development planning studies.
Given the range of tools available for aerial and satellite remote sensing, their applications vary according to the advantages and limitations of each. Their use in assessments of each of the major natural hazards is discussed in the following paragraphs.
Floods
The most obvious evidence of a major flood potential, outside of historical evidence, is identification of floodplain or flood-prone areas, which are generally recognizable on remote sensing imagery. The most valuable application of remote sensing to flood hazard assessments, then, is in the mapping of areas susceptible to flooding, and satellite sensor coverage of a planning study area is the practical tool for floodplain definition because of cost and time factors. Such mapping may permit the delineation of potentially flood-prone areas where the defined flood level exceeds an acceptable degree of loss. When no floods have occurred during the period of the sensor operation, indirect indicators of flood susceptibility may be used to determine such levels.
But cloud cover or heavy haze will conceal large parts of tropical humid ecosystems from satellite imagery. In some instances the heavy tropical vegetation masks many of the geomorphic features so obvious in drier climates. In this case the use of available radar imagery from space or previously acquired from an aircraft survey is desirable. The radar imagery can satisfactorily penetrate the clouded sky and define many floodplain features. Moisture on the ground noticeably affects the radar return and, together with the textural variations emphasized by the sensor, makes radar a suitable alternative for flood and floodplain mapping.
Hurricanes
Areas of potential inundation along coasts and inland can be predicted using topographic maps with scales as large as 1:12,500. When such maps are not available, remote sensing techniques can be used. In areas with a distinct wet and dry season, information for the wet season can be obtained from high-resolution satellite imagery to identify both the moisture-saturated areas susceptible to flooding and the higher and drier ground for potential evacuation areas.
If imagery of areas inundated by floods, hurricanes, or other storms is obtained with any sensor immediately after the event, it should be used regardless of its resolution, since its delineation of problem areas will be more exact than any interpretations of higher-resolution data from a non-flood period.
Earthquakes
In most areas of earthquake activity some seismic information is usually available, although it may not be sufficient for planning purposes. Remote sensing techniques and resulting data interpretation can play a role in providing the additional information needed.
Airborne radar has been successfully used to locate fault zones, to identify unconsolidated deposits - upon which most of the destruction occurs - and to delineate areas where an earthquake can trigger landslides. Conventional aerial photography, in black and white or color, would also work well.
Color IR composites from satellite imagery, at scales up to about 1:100,000, can also be used to define active surface fault zones. Radar would be better, but the available coverage is extremely limited and the cost of contracting airborne radar is usually prohibitive. Satellite imagery from Landsat is the most practical data source, simply because of its availability, and provides sufficient resolution for regional planning studies.
Volcanic Eruptions and Related Hazards
Prediction of a volcano's behavior is extremely difficult, and the best evidence for the frequency and severity of activity is the history of eruptions. The interpretation of remote sensing data can lead to a recognition of past catastrophic events associated with recently active volcanoes. This information can be supplemented with the available historical data.
The varied nature and sizes of volcanic hazards require the use of various types of sensors from both satellites and aircraft. The relatively small area involved with volcanoes should encourage the use of aerial photography in their analysis. Black-and-white aerial coverage at scales between 1:25,000 and 1:60,000 is usually adequate to recognize and map geomorphic evidence of recent activity and associated hazards. Color and color IR photography may be useful in determining the possible effects of volcanic activity on nearby vegetation, but the slower film speed, lower resolution, and high cost diminish much of any advantage they provide.
The airborne thermal IR scanner is probably the most valuable tool in surveying the geothermal state of a volcano. The heat within a volcano and underlying it and its movement are amenable to detection, and many volcanoes thought to be extinct may have to be reclassified if aerial IR surveys discover any abnormally high IR emissions from either the summit craters or the flanks. However, because of the rapid decrease in resolution with increasing altitude (about 2 m per 1,000 m), the surveys need to be made at altitudes under 2,000 m.
Landslides
In an area with a potential landslide hazard there is usually some evidence of previous occurrences, if not some historical record. Usually the scars of the larger slides are evident, and although smaller slide features may not be individually discernible, the overall rough appearance of a particular slope can suggest that mass movement occurred.
The spatial resolution required for the recognition of most large landslide features is about 10 m.7/ This precludes the use of most satellite-borne sensor imagery, although large block landslides can be detected on Landsat. Recognition depends to a great extent on the ability and experience of the interpreter and is enhanced by the availability of stereoscopic coverage, which can be expensive to acquire.
7/ Richards, P. B. The Utility of Landsat-D and Other Satellite Imaging Systems in Disaster Management, Final Report. NASA Goddard Space Flight Center Disaster Management Workshop, NASA DPR S-70677 (Washington, D.C.: Naval Research Laboratory, March 29-30, 1982).
The best sensor system for detecting both large and (to the extent that they can be found at all) small landslides is aerial photography, and photographic scales as small as 1:60,000 can be used. Black-and-white panchromatic or IR films are adequate in most cases, but color IR may prove better in some instances, since it eliminates much of the haze found in the humid tropics.
Other possibly applicable techniques include thermal IR scanners and radars. The thermal IR scanner is particularly helpful in locating seepage areas that lubricate slides, but its use is usually ruled out by the low altitude required for reasonable spatial resolution, the large number of flight lines required for the large area involved, and the geometric distortions inherent in the system. Radar can be marginally useful because of its ability to define some larger textures related to landslides, and it may be the only sensor that can provide interpretable information in some cloud-prone environments.
Desertification
Both spaceborne and airborne remote sensing provide valuable tools for evaluating areas subject to desertification. Film transparencies, photographs, and digital data can be used to locate, assess, and monitor the deterioration of natural conditions in a given area. Information about these conditions can be obtained from direct measurements or inferred from indicators.
Large-scale aerial photography provides a great amount of detail for desertification studies. Systematic reconnaissance flights can be used for environmental monitoring and resource assessment. Radar sensors and IR scanners may be used to monitor soil moisture and other desertification indicators. However, acquisition of this type of data is costly and time-consuming. The use of satellite imagery is recommended during the first stages of a detailed desertification study, since it offers an overview of the entire region.
As for any other natural-hazard-related study, the data from aerial and space remote sensing must be combined with data collected on the ground. Together, these can provide the basis for the assessment.
The use of mapping to synthesize data on natural hazards and to combine these with socioeconomic data facilitates analysis and improves communications among participants in the hazard management process and between planners and decision-makers. Two important techniques are multiple hazard mapping and critical facilities mapping. The discussion below treats the preparation of these maps, their applications, and the benefits of combining them.
Multiple Hazard Mapping
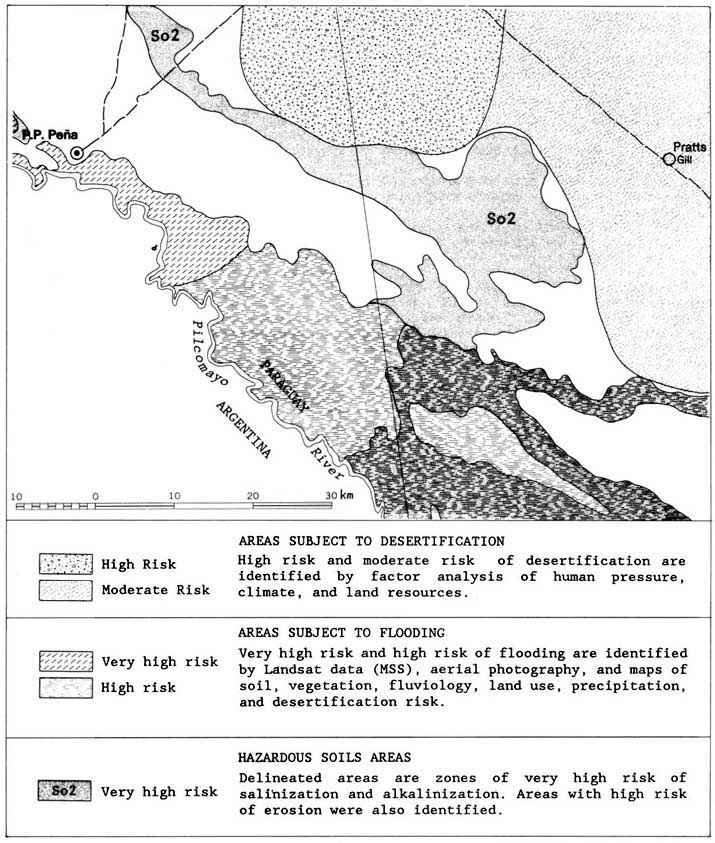
Valuable information on individual natural hazards in a study area may appear on maps with varying scales, coverage, and detail, but these disparate maps are difficult to use in risk analyses or in deciding on suitable mitigation measures. Information from several of them can be combined in a single map to give a composite picture of the magnitude, frequency, and area of effect of all the natural hazards (see Figure 17).
The multiple hazard map (MHM; also called a composite, synthesis, or overlay map) is an excellent tool for fomenting an awareness of natural hazards and for analyzing vulnerability and risk, especially when combined with the mapping of critical facilities. Its benefits include the following:
- Characteristics of the natural phenomena and their possible impacts can be synthesized from different sources and placed on a single map.- It can call attention to hazards that may trigger others (as earthquakes or volcanic eruptions trigger landslides) or exacerbate their effects.
- A more precise view of the effects of natural phenomena on a particular area can be obtained. Common mitigation techniques can be recommended for the same portion of the study area.
- Sub-areas requiring more information, additional assessments, or specific hazard-reduction techniques can be identified.
- Land-use decisions can be based on all hazard considerations simultaneously.
Figure 17 - NATURAL HAZARDS MAP OF THE PARAGUAYAN CHACO
Source: Adapted from OEA. Proyecto de Desarrollo Urbano Paraguayo. Mapa de Riesgos Naturales del Chaco Paraguayo, Area de Programa 4-C. (Washington, D.C.: Organization of American States, 1985).
The use of a multiple hazard map also has several implications in emergency preparedness planning:
- It provides a more equitable basis for allocating disaster planning funds.- It stimulates the use of more efficient, integrated emergency preparedness response and recovery procedures.
- It promotes the creation of cooperative agreements to involve all relevant agencies and interested groups.
The base map upon which to place all the information is the first consideration. It is usually selected during the preliminary mission. If at all possible, it is best to use an existing map or controlled photograph rather than go through the difficult and time-consuming process of creating a base map from scratch.
The scale used for an MHM depends on the hazard information to be shown, and the scale of the base map. If a choice of scales is available, then the following factors should be considered:
- Number of hazards to be shown.
- Hazard elements to be shown.
- Range of relative severity of hazards to be shown.
- Area to be covered.
- Proposed uses of the map.
Much hazard information will be in forms other than maps, and not readily understandable by laymen. It must be "translated" for planners and decision-makers and placed on maps. The information should explain how a hazard may adversely affect life, property, or socioeconomic activities, and must therefore include location, likelihood of occurrence (return period), and severity. If some of this information is missing, the planning team must decide whether it is feasible to fill the gaps. Development and investment decisions made in the absence of these data should be noted.
Despite the importance of multiple hazard maps in the integrated development planning process, planners and decision-makers must remember that the credibility, accuracy, and content of an MHM are no better than the individual hazard information from which it was compiled. Furthermore, since it contains no new information - it is merely a clearer presentation of information previously compiled - the clarity and simplicity of the map is the key to its utility.
Critical Facilities Mapping
The term "critical facilities" means all man-made structures or other improvements whose function, size, service area, or uniqueness gives them the potential to cause serious bodily harm, extensive property damage, or disruption of vital socioeconomic activities if they are destroyed or damaged or if their services are repeatedly interrupted.
The primary purpose of a critical facilities map (CFM) is to convey clearly and accurately to planners and decision-makers the location, capacity, and service area of critical facilities. An extensive number of such facilities can be presented at the same time. Also, when combined with a multiple hazard map, a CFM can show which areas require more information, which ones require different hazard reduction techniques, and which need immediate attention when a hazardous event occurs. Some of the benefits of a CFM are:
- The lack of redundancy or the uniqueness of service of facilities is discovered.- Facilities that may require upgrading and expansion are identified.
- The impact of potential development on existing infrastructure can be assessed before a project is implemented.
- Any need for more (or better) hazard assessment becomes apparent.
Combining Critical Facilities Maps and Multiple Hazard Maps
There are many advantages to making a CFM, comparing or combining it with a MHM, and integrating both into the development planning process. For example, if a critical facility is found to be in a hazardous area planners and decision-makers are alerted to the fact that in the future it may confront serious problems. Its equipment, use and condition can then be analyzed to evaluate its vulnerability.
If appropriate techniques to reduce any vulnerability are incorporated into each stage of the planning process, social and economic disasters can be avoided or substantially lessened. New critical facilities can be made less vulnerable by avoiding hazardous areas, designing for resistance, or operating with minimal exposure. Strategies for existing critical facilities include relocation, strengthening, retrofitting, adding redundancy, revising operations, and adopting emergency preparedness, response, and recovery programs.
The benefits obtained by combining a CFM and an MHM include:
- Project planners and decision-makers are made aware of hazards to existing and proposed critical facilities prior to project implementation.- The extent to which new development can be affected by the failure or disruption of existing critical facilities as a consequence of a natural event can be determined.
- More realistic benefit-cost ratios for new development are possible.
- Sub-areas requiring different assessments, emergency preparedness, immediate recovery, or specific vulnerability reduction techniques can be identified.
The combination of CFM and MHM can be used by agencies concerned with land-use planning, preparedness and disaster response, utility services including energy, transportation, and communication, and national security and community safety. It is also important when preparing investment projects for national and international bank lending. A discussion of the various uses follows.
Land-Use Planning. Land-use planning is one of the most efficient ways of avoiding or reducing the density of development in hazardous areas. In one seismic-prone California (U.S.A.) county, all the potential earthquake hazards - liquefaction, lurching, lateral spreading, differential settlement, ground displacement, landslides, and flooding due to dike failure - were combined on an MHM and three zones were marked out to indicate different degrees of need for detailed site investigations. Urban settlements, transportation, utilities, and emergency facilities were then superimposed. This graphic presentation made citizens, as well as planners and decision-makers, aware of the potential damage in the varying hazard zones. In addition, large-scale maps can show potential hazards in relation to property boundaries.
Development Regulations. Sometimes critical facilities and hazards information are shown on a map selected for regulatory purposes. For example, a 1972 California law provides for public safety by restricting development in surface fault rupture zones. Reproducible copies of pertinent maps showing numerous critical facilities have been provided to each affected county and city.
Disclosure in Land Title Transfers. Often a combination CFM-MHM map is used for orientation of purchasers of land. Local authorities could require lenders or sellers of real property to let the prospective borrower or buyer know whether the property is located in a hazard-prone area. To facilitate compliance with these laws, local boards of real estate agents can prepare street-index maps showing the hazard zones.
Public Awareness. Often a prerequisite to obtaining support for integrated development planning and hazard reduction is public awareness of not only the hazards but those critical facilities that will be affected. As an example, more than 1,100 miles of Pacific Ocean coastline in California were mapped into three hazard zones reflecting a combination of coastal erosion, wave-cut cliffs, slumping, bluff retraction, landslides, creep, rockfalls, and storm waves.8/ The purpose of such studies is to help planners, investors, and decision-makers make more educated decisions about building, buying, and living in hazard-prone areas.
8/ Griggs, G., and L. Savoy (eds.). Living with the California Coast (Durham, North Carolina: Duke University Press, 1985).
Emergency Preparedness Planning. Maps can be prepared to show the critical facilities-highways, airports, railroads, docks, communication lines, water-supply and waste-disposal systems, and electrical power, natural gas, and petroleum lines-that would require a major emergency response from a damaging natural event. The telecommunications map, for example, could assess telephone-system performance after a postulated earthquake. Similarly, maps for water-supply and waste-disposal facilities can show the location and estimates of damage to facilities. Most of the lifelines susceptible to significant damage that require a major response effort can be identified and measures planned.
Site Selection. Often the likelihood, location, and severity of natural hazards are used as criteria in selecting a site for a critical facility. For example, one study, which identified areas warranting further study for use as disposal sites for hazardous wastes, recommended that these disposal sites and facilities be located so as not to adversely affect human health and safety, air and water quality, wildlife, critical environmental resources, and urbanized areas.9/ Sites that may be subject to inundation, washout, faulting, liquefaction, landsliding, or accelerated erosion were deemed unacceptable.
9/ Perkins, J.B. Identification of Possible Class I Site Areas, Solid Waste Management Plan. Technical Memorandum 7 (Berkeley, California: Association of Bay Area Governments, 1978).
Likewise, the location and assessment of natural hazards have been key determinants in the selection of sites for offshore structures, electrical power generating stations, hydroelectric dams, water pipes, liquefied natural gas terminals, schools, and other critical facilities.
![]()
![]()
![]()
![]()